Note: This question is part of a series of questions that present the same scenario. Each question in the series contains a unique solution that might meet the stated goals. Some question sets might have more than one correct solution, while others might not have a correct solution.
After you answer a question in this section, you will NOT be able to return to it. As a result, these questions will not appear in the review screen.
You have a Power BI report that imports a date table and a sales table from an Azure SQL database data source. The sales table has the following date foreign keys:
✑ Due Date
✑ Order Date
✑ Delivery Date
You need to support the analysis of sales over time based on all the date foreign keys.
Solution: For each date foreign key, you add inactive relationships between the sales table and the date table.
Does this meet the goal?
Answer:
B
Instead: Solution: From the Fields pane, you rename the date table as Due Date. You use a DAX expression to create Order Date and Delivery Date as calculated tables.
Reference:
https://docs.microsoft.com/en-us/power-bi/guidance/relationships-active-inactive
Note: This question is part of a series of questions that present the same scenario. Each question in the series contains a unique solution that might meet the stated goals. Some question sets might have more than one correct solution, while others might not have a correct solution.
After you answer a question in this section, you will NOT be able to return to it. As a result, these questions will not appear in the review screen.
You have a Power BI report that imports a date table and a sales table from an Azure SQL database data source. The sales table has the following date foreign keys:
✑ Due Date
✑ Order Date
✑ Delivery Date
You need to support the analysis of sales over time based on all the date foreign keys.
Solution: From Power Query Editor, you rename the date query as Due Date. You reference the Due Date query twice to make the queries for Order Date and
Delivery Date.
Does this meet the goal?
Answer:
B
Instead: Solution: From the Fields pane, you rename the date table as Due Date. You use a DAX expression to create Order Date and Delivery Date as calculated tables.
Reference:
https://docs.microsoft.com/en-us/power-bi/guidance/relationships-active-inactive
Note: This question is part of a series of questions that present the same scenario. Each question in the series contains a unique solution that might meet the stated goals. Some question sets might have more than one correct solution, while others might not have a correct solution.
After you answer a question in this section, you will NOT be able to return to it. As a result, these questions will not appear in the review screen.
You have a Power BI report that imports a date table and a sales table from an Azure SQL database data source. The sales table has the following date foreign keys:
✑ Due Date
✑ Order Date
✑ Delivery Date
You need to support the analysis of sales over time based on all the date foreign keys.
Solution: From the Fields pane, you rename the date table as Due Date. You use a DAX expression to create Order Date and Delivery Date as calculated tables.
Does this meet the goal?
Answer:
A
Refactoring methodology -
Here's a methodology to refactor a model from a single role-playing dimension-type table, to a design with one table per role.
1. Remove any inactive relationships.
2. Consider renaming the role-playing dimension-type table to better describe its role. In the example (not present here), the Airport table is related to the
ArrivalAirport column of the Flight table, so it's renamed as Arrival Airport.
3. Create a copy of the role-playing table, providing it with a name that reflects its role. If it's an Import table, we recommend defining a calculated table. If it's a
DirectQuery table, you can duplicate the Power Query query.
In the example, the Departure Airport table was created by using the following calculated table definition.
Departure Airport = 'Arrival Airport'
Create an active relationship to relate the new table.
4. Consider renaming the columns in the tables so they accurately reflect their role. In the example, all columns are prefixed with the word Departure or Arrival.
These names ensure report visuals, by default, will have self-describing and non-ambiguous labels. It also improves the Q&A experience, allowing users to easily write their questions.
5. Consider adding descriptions to role-playing tables. (In the Fields pane, a description appears in a tooltip when a report author hovers their cursor over the table.) This way, you can communicate any additional filter propagation details to your report authors.
Reference:
https://docs.microsoft.com/en-us/power-bi/guidance/relationships-active-inactive
DRAG DROP -
You receive revenue data that must be included in Microsoft Power BI reports.
You preview the data from a Microsoft Excel source in Power Query as shown in the following exhibit.
You plan to create several visuals from the data, including a visual that shows revenue split by year and product.
You need to transform the data to ensure that you can build the visuals. The solution must ensure that the columns are named appropriately for the data that they contain.
Which three actions should you perform in sequence? To answer, move the appropriate actions from the list of actions to the answer area and arrange them in the correct order.
Select and Place:
Answer:

Step 1: Select Department and Product and Unpivot Other Columns
The Unpivot Other Columns command unpivots unselected columns. Use this command in a query when not all columns are known. New columns added during a refresh operation are also unpivoted.
Note: Unpivot columns: In Power Query, you can transform columns into attribute-value pairs, where columns become rows.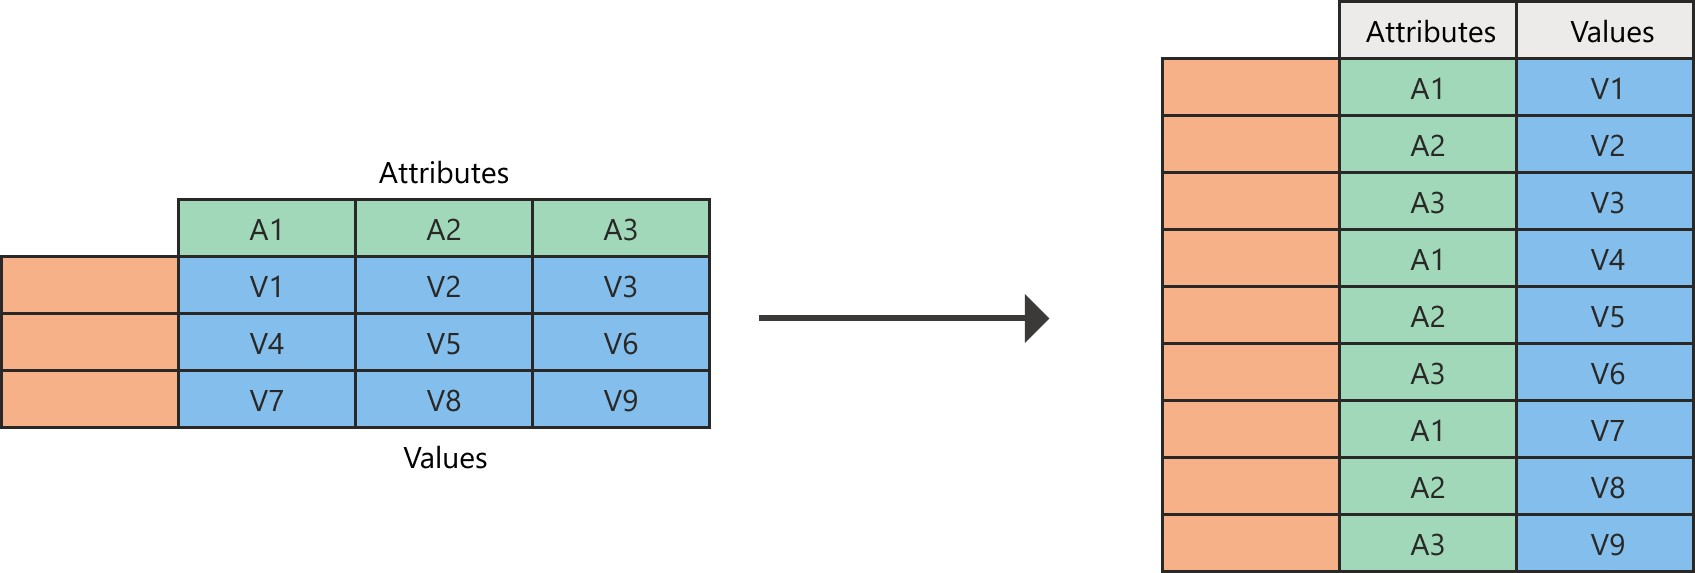
Step 2: Rename the Attribue column to Year and the Value Column to Revenue
Need to do this after the unpivot.
Power Query will always create the attribute-value pair by using two columns:
Attribute: The name of the column headings that were unpivoted.
Value: The values that were underneath each of the unpivoted column headings.
Step 3: Select Use the First Row as Headers
Reference:
https://docs.microsoft.com/en-us/power-query/unpivot-column
HOTSPOT -
You have a Power BI report named Orders that supports the following analysis:
✑ Total sales over time
✑ The count of orders over time
✑ New and repeat customer counts
The data model size is nearing the limit for a dataset in shared capacity.
The model view for the dataset is shown in the following exhibit.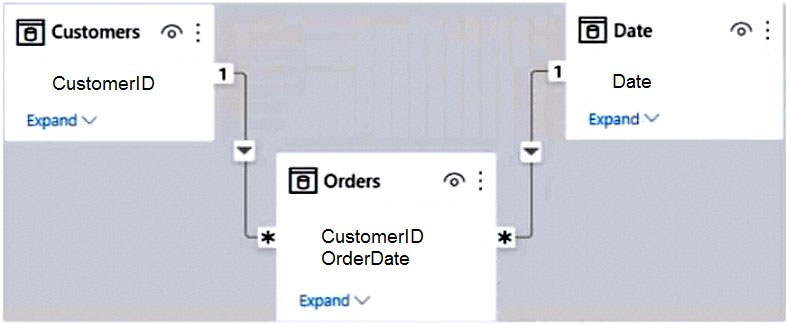
The data view for the Orders table is shown in the following exhibit.
The Orders table relates to the Customers table by using the CustomerID column.
The Orders table relates to the Date table by using the OrderDate column.
For each of the following statements, select Yes if the statement is true, Otherwise, select No.
NOTE: Each correct selection is worth one point.
Hot Area: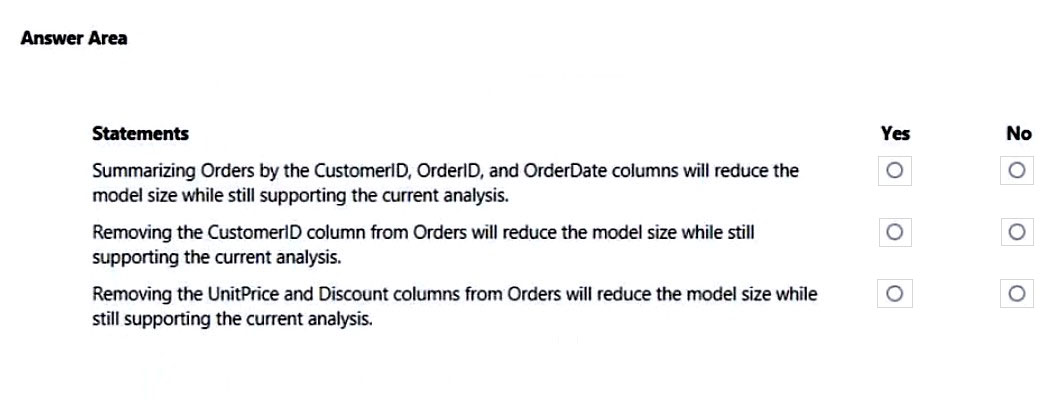
Answer:
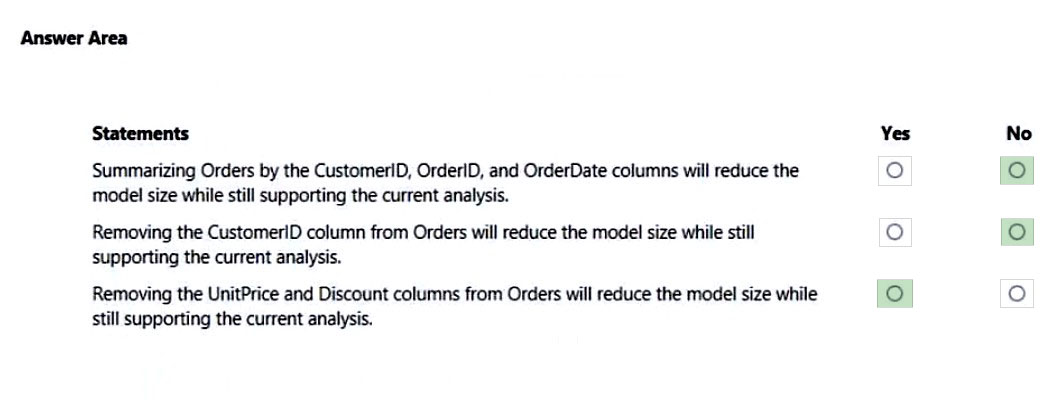
Box 1: No -
Would not support total sales over time.
Box 2: No -
Would not support new and repeat customer counts
Box 3: Yes
HOTSPOT -
You are building a financial report by using Power BI.
You have a table named financials that contains a column named Date and a column named Sales.
You need to create a measure that calculates the relative change in sales as compared to the previous quarter.
How should you complete the measure? To answer, select the appropriate options in the answer area.
NOTE: Each correct selection is worth one point.
Hot Area: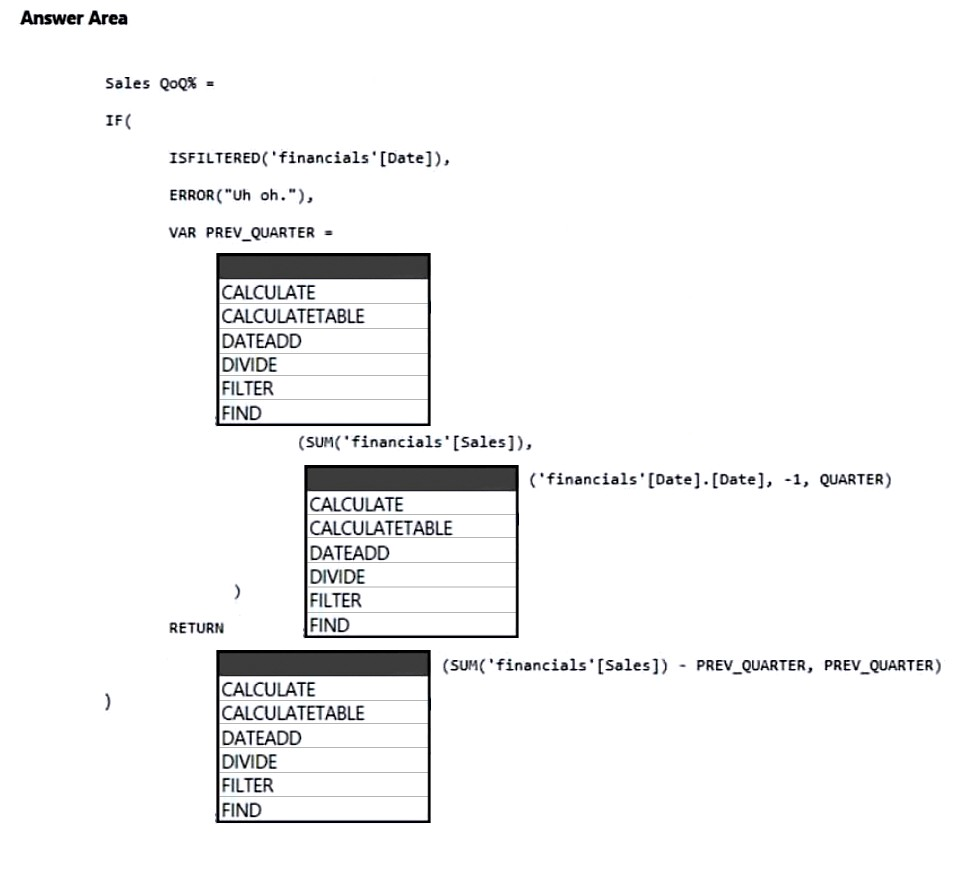
Answer:
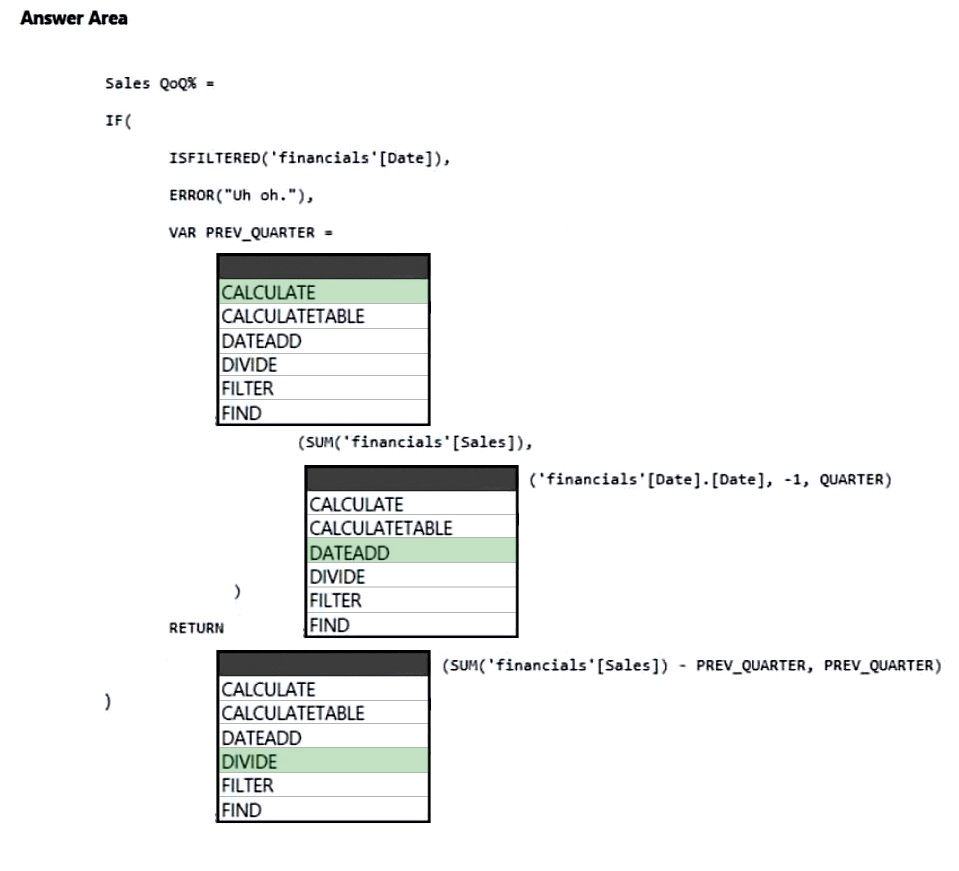
Box 1: CALCULATE -
Calculate the sum.
Box 2: DATEADD -
DATEADD -1 QUARTER will give the previous month.
Box 3: DIVIDE -
Use DIVIDE to get the relative change.
DRAG DROP -
You are creating a Power BI model and report.
You have a single table in a data model named Product. Product contains the following fields:
✑ ID
✑ Name
✑ Color
✑ Category
✑ Total Sales
You need to create a calculated table that shows only the top eight products based on the highest value in Total Sales.
How should you complete the DAX expression? To answer, drag the appropriate values to the correct targets. Each value may be used once, more than once, or not at all. You may need to drag the split bar between panes or scroll to view content.
Select and Place: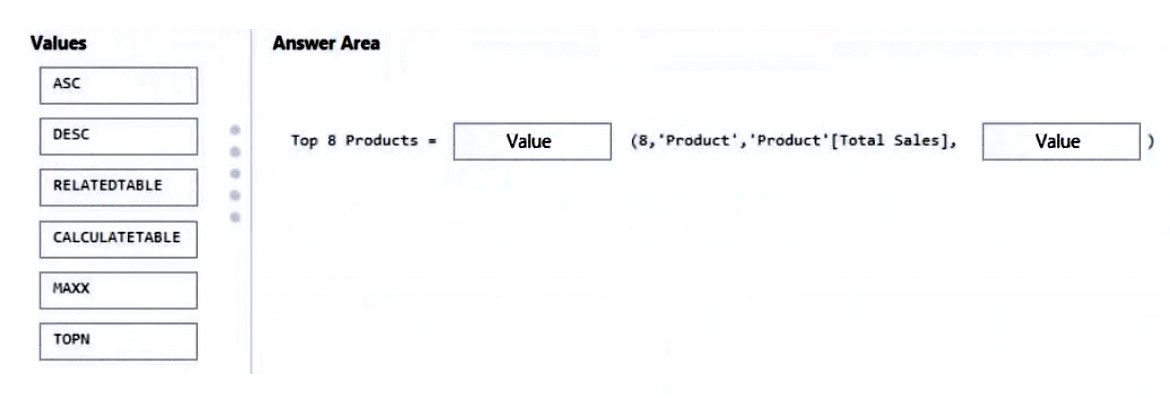
Answer:
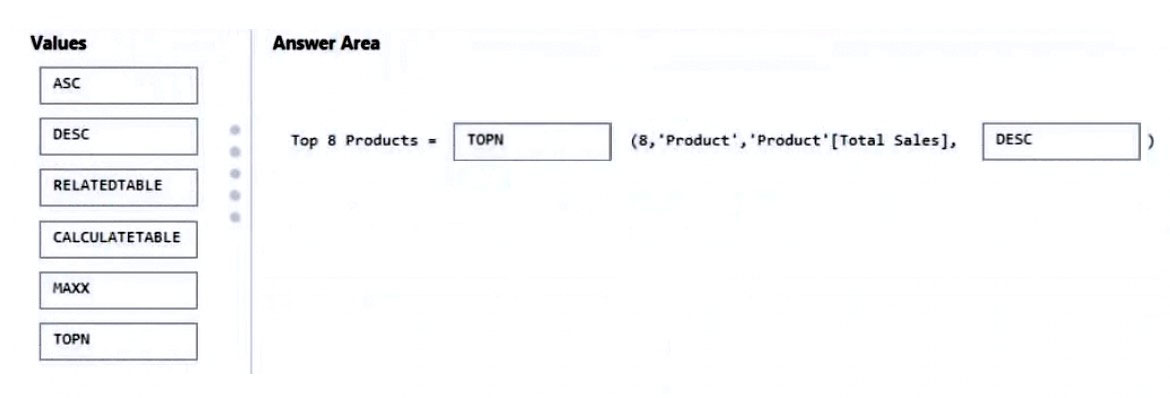
Box 1: TOPN -
TOPN returns the top N rows of the specified table.
Syntax: TOPN(<n_value>, <table>, <orderBy_expression>, [<order>[, <orderBy_expression>, [<order>]]ג€¦])
Box 2: DESC -
Descending order to get the highest values first.
Reference:
https://docs.microsoft.com/en-us/dax/topn-function-dax
You are creating a sales report in Power BI for the NorthWest region sales territory of your company. Data will come from a view in a Microsoft SQL Server database. A sample of the data is shown in the following table:
The report will facilitate the following analysis:
✑ The count of orders and the sum of total sales by Order Date
✑ The count of customers who placed an order
✑ The average quantity per order
You need to reduce data refresh times and report query times.
Which two actions should you perform? Each correct answer presents part of the solution.
NOTE: Each correct selection is worth one point.
Answer:
CD
C: Remove columns that are not used in the report.
D: Reduce the number of rows.
Incorrect:
Not A: Not possible.
Not B: Need CustomerKey to count of customers who placed an order
You are creating a Power BI model that contains a table named Store. Store contains the following fields.
You plan to create a map visual that will show store locations and provide the ability to drill down from Country to State/Province to City.
What should you do to ensure that the locations are mapped properly?
Answer:
C
A hierarchy is a set of fields categorized in a hierarchical way that one level is the parent of another level. Values of the parent level can be drilled down to the lower level.
Create Hierarchy -
Right-click on the field you want to set as level 1 of the hierarchy in the fields list, and then select Create Hierarchy.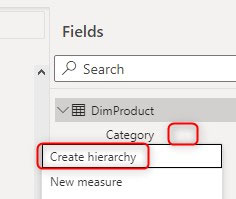
After that, you will see a new hierarchy created named your field name ג€Categoryג€ plus the word ג€Hierarchyג€. This would have a hierarchy icon beside it and also an option to expand to the fields of the hierarchy. If you expand, you will see a copy of the Category field in there too.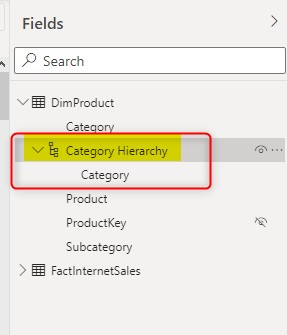
Etc.
Reference:
https://radacad.com/what-a-power-bi-hierarchy-is-and-how-to-use-it
You are building a data model for a Power BI report.
You have data formatted as shown in the following table.
You need to create a clustered bar chart as shown in the following exhibit.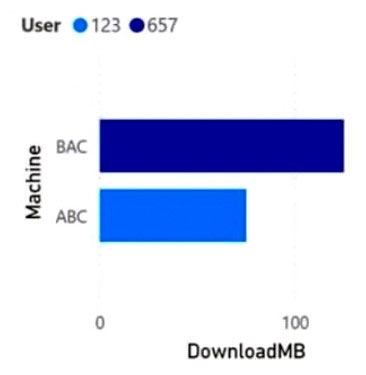
What should you do?
Answer:
A
Split a column of text (Power Query)
You can split a column with a text data type into two or more columns by using a common delimiter character. For example, a Name column that contains values written as <LastName>, <FirstName> can be split into two columns using the comma (,) character.
Note: Power Query is an Extract Transform Load (ETL) tool. It allows us to
Download and fetch data from different sources. We call this data ingestion
Combine, clean, and model this data. We call this data wrangling
Reference:
https://support.microsoft.com/en-us/office/split-a-column-of-text-power-query-5282d425-6dd0-46ca-95bf-8e0da9539662