DRAG DROP -
You need create a date table in Power BI that must contain 10 full calendar years, including the current year.
How should you complete the DAX expression? To answer, select the appropriate options in the answer area.
NOTE: Each correct selection is worth one point.
Select and Place: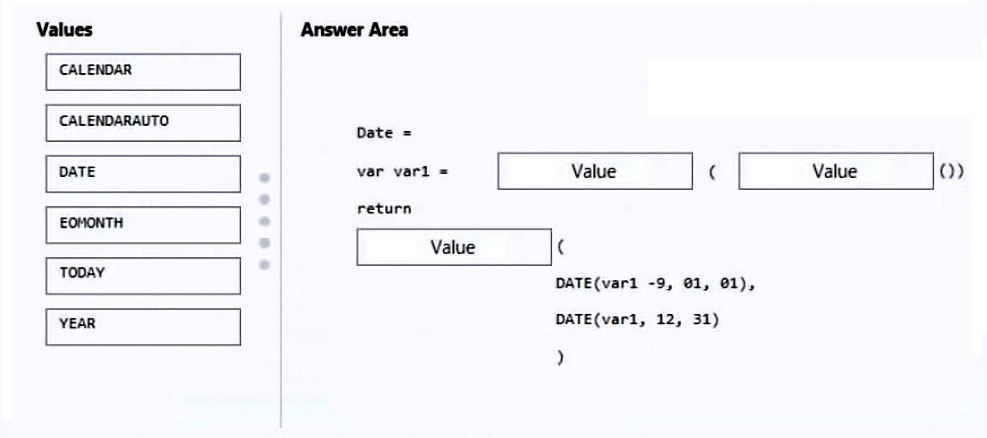
Answer:
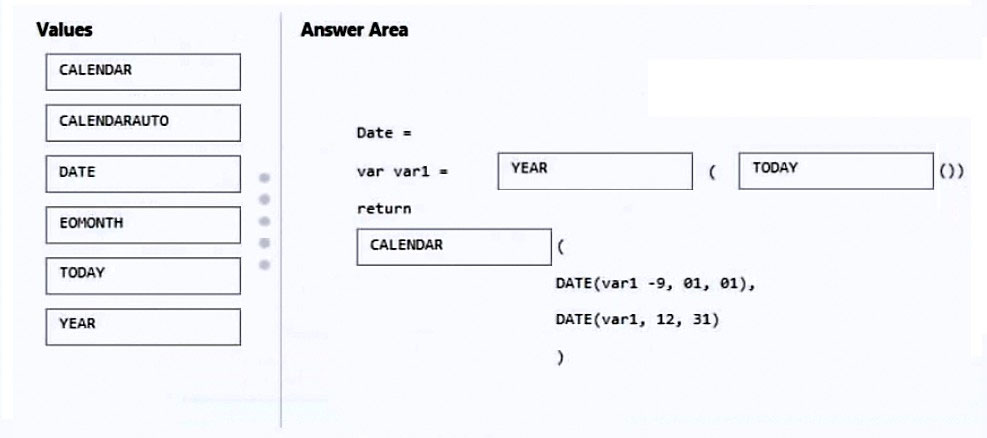
Box 1: YEAR -
Get the current year.
Box 2: TODAY -
TODAY returns the current date.
Box 3: CALENDAR -
CALENDAR returns a table with a single column named ג€Dateג€ containing a contiguous set of dates. The range of dates is from the specified start date to the specified end date, inclusive of those two dates.
The following formula returns a table with dates between January 1st, 2005 and December 31st, 2015.
CALENDAR (
DATE ( 2005, 1, 1 ),
DATE ( 2015, 12, 31 )
Reference:
https://dax.guide/calendar/
Note: This question is part of a series of questions that present the same scenario. Each question in the series contains a unique solution that might meet the stated goals. Some question sets might have more than one correct solution, while others might not have a correct solution.
After you answer a question in this section, you will NOT be able to return to it. As a result, these questions will not appear in the review screen.
You have a Power BI report that imports a date table and a sales table from an Azure SQL database data source. The sales table has the following date foreign keys:
✑ Due Date
✑ Order Date
✑ Delivery Date
You need to support the analysis of sales over time based on all the date foreign keys.
Solution: You create measures that use the USERELATIONSHIP DAX function to filter sales on the active relationship between the sales table and the date table.
Does this meet the goal?
Answer:
B
Instead: Solution: From the Fields pane, you rename the date table as Due Date. You use a DAX expression to create Order Date and Delivery Date as calculated tables.
Reference:
https://docs.microsoft.com/en-us/power-bi/guidance/relationships-active-inactive
HOTSPOT -
You have a Power BI report that contains a measure named Total Sales.
You need to create a new measure that will return the sum of Total Sales for a year up to a selected date.
How should you complete the DAX expression? To answer, select the appropriate options in the answer area.
NOTE: Each correct selection is worth one point.
Hot Area:
Answer:

Box 1: TOTALYTD -
TOTALYTD evaluates the specified expression over the interval which begins on the first day of the year and ends with the last date in the specified date column after applying specified filters.
Syntax: TOTALYTD (
<Expression>,
<Dates>
[, <Filter>]
[, <YearEndDate>]
Expression - The expression to be evaluated.
Dates - The name of a column containing dates or a one column table containing dates.
Example:
TOTALYTD ( -- 2007-01-01 : 2007-05-12
[Sales Amount],
'Date'[Date]
Box 2: 'Date'[Date]
Reference:
https://dax.guide/totalytd/
DRAG DROP -
You are modifying a Power BI model by using Power BI Desktop.
You have a table named Sales that contains the following fields.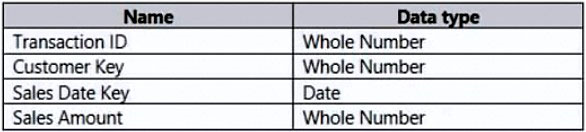
You have a table named Transaction Size that contains the following data.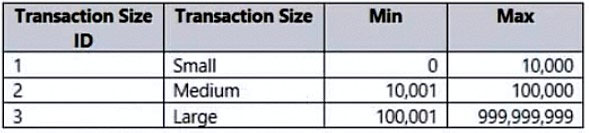
You need to create a calculated column to classify each transaction as small, medium, or large based on the value in Sales Amount.
How should you complete the code? To answer, drag the appropriate values to the correct targets. Each value may be used once, more than once, or not at all.
You may need to drag the split bar between panes or scroll to view content.
NOTE: Each correct selection is worth one point.
Select and Place: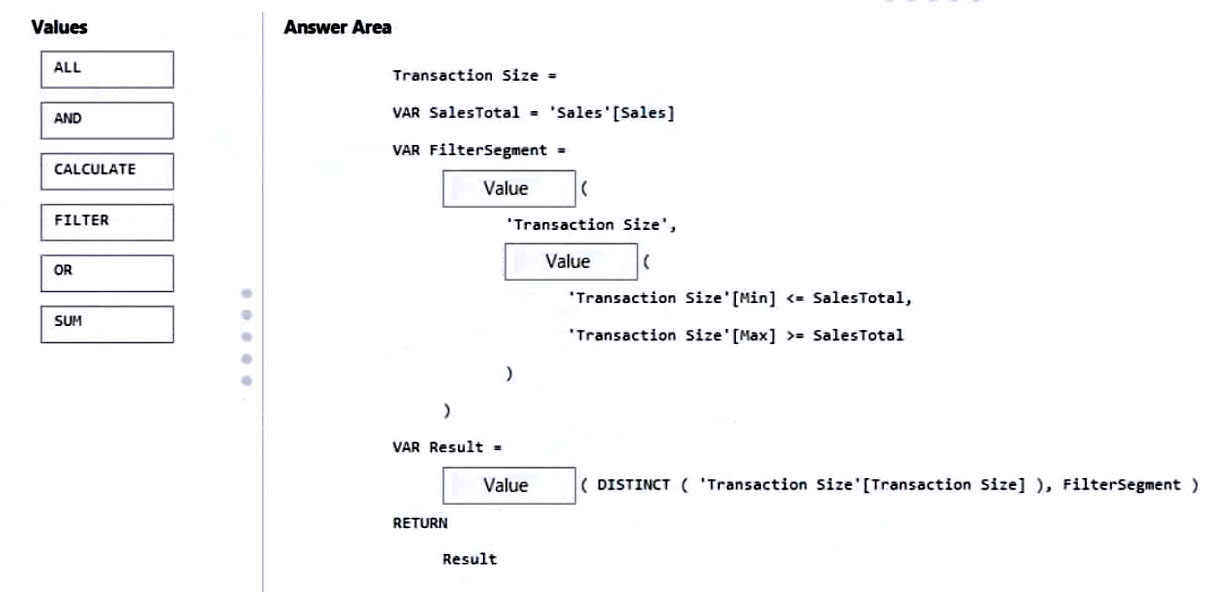
Answer:
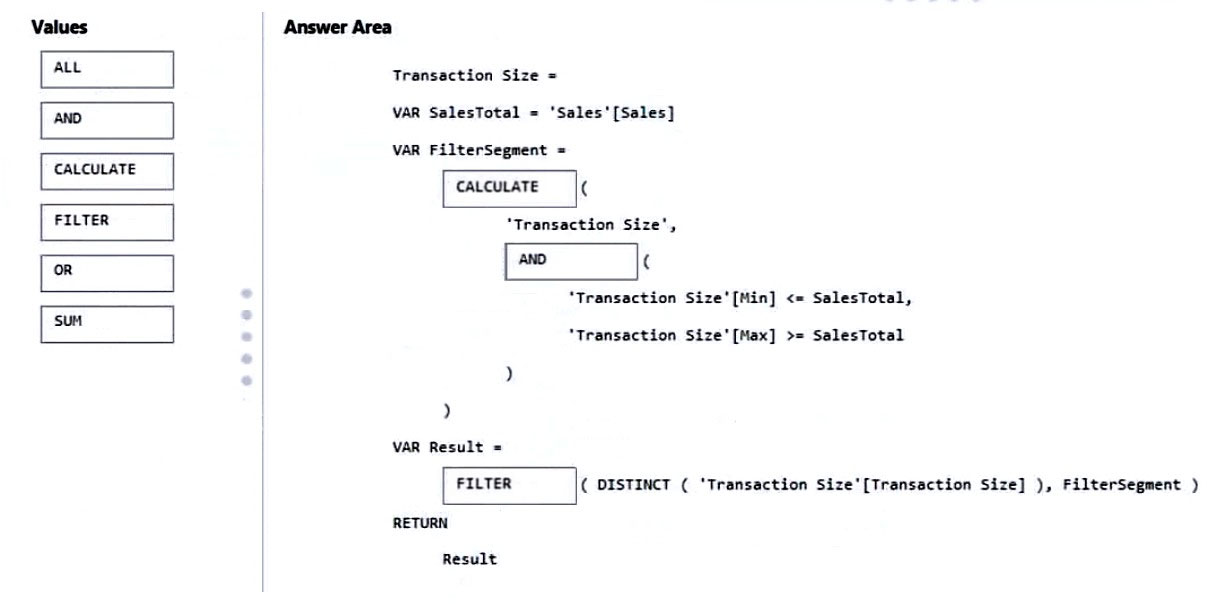
Box 1: CALCULATE -
CALCULATE evaluates an expression in a modified filter context.
Syntax: CALCULATE(<expression>[, <filter1> [, <filter2> [, ג€¦]]])
The expression used as the first parameter is essentially the same as a measure.
Filters can be:
Boolean filter expressions -
Table filter expressions -
Filter modification functions -
Table filter expression -
A table expression filter applies a table object as a filter. It could be a reference to a model table, but more likely it's a function that returns a table object. You can use the FILTER function to apply complex filter conditions, including those that cannot be defined by a Boolean filter expression.
Box 2: AND -
Box 3: FILTER -
FILTER returns a table that represents a subset of another table or expression.
Syntax: FILTER(<table>,<filter>)
Note: DISTINCT returns a one-column table that contains the distinct values from the specified column. In other words, duplicate values are removed and only unique values are returned.
Reference:
https://docs.microsoft.com/en-us/dax/calculate-function-dax
https://docs.microsoft.com/en-us/dax/filter-function-dax
You have a Power BI report for the procurement department. The report contains data from the following tables.
There is a one-to-many relationship from Suppliers to LineItems that uses the ID and Supplier ID columns.
The report contains the visuals shown in the following table.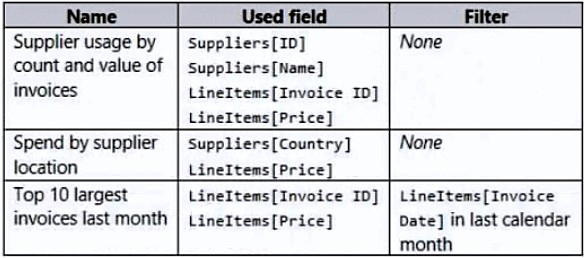
You need to minimize the size of the dataset without affecting the visuals.
What should you do?
Answer:
B
Remove a column that is not used in the visuals reduces the size of the dataset.
Incorrect:
Not A: Merging the tables would increase the dataset.
Not C: Two of the visuals need historical data.
Not D: Grouping would not affect size.
You have a Power BI report for the marketing department. The report reports on web traffic to a blog and contains data from the following tables.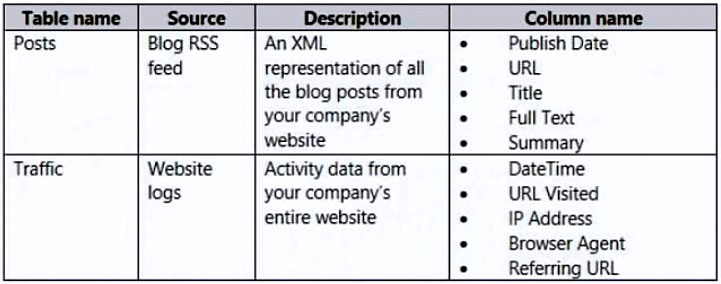
There is a one-to-many relationship from Posts to Traffic that uses the URL and URL Visited columns.
The report contains the visuals shown in the following table.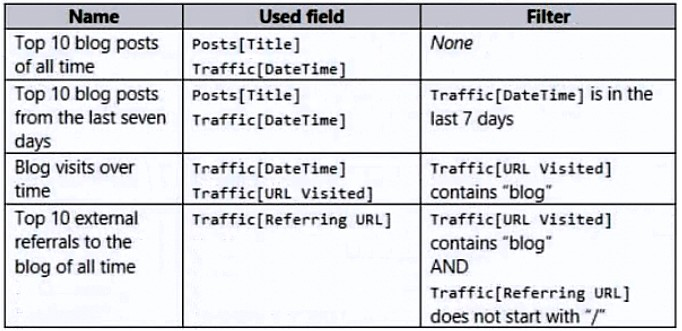
The dataset takes a long time to refresh.
You need to modify Posts and Traffic queries to reduce load times.
Which two actions will reduce the load times? Each correct answer presents part of the solution.
NOTE:
Each correct selection is worth one point.
Answer:
BD
B: Only blog posts rows are useful for the visuals.
D: These two columns are not used in the visuals and can be removed.
Incorrect:
Not A: Three visuals need historical data.
Not C: Traffic[Referring URL] is used in one of the visuals and therefore cannot be removed.
Not E: These rows are used in 3 visuals.
HOTSPOT
-
You are creating a quick measure as shown in the following exhibit.
You need to create a monthly rolling average measure for Sales over time.
How should you configure the quick measure calculation? To answer, select the appropriate options in the answer area.
NOTE: Each correct selection is worth one point.
Answer:

You have the Power BI data model shown in the following exhibit.
The Sales table contains records of sales by day from the last five years up until today’s date.
You plan to create a measure to return the total sales of March 2021 when March 2022 is selected.
Which DAX expression should you use?
Answer:
C
You use Power BI Desktop to load data from a Microsoft SQL Server database.
While waiting for the data to load, you receive the following error.
You need to resolve the error.
What are two ways to achieve the goal? Each correct answer presents a complete solution.
NOTE: Each correct selection is worth one point.
Answer:
AB
Note: This question is part of a series of questions that present the same scenario. Each question in the series contains a unique solution that might meet the stated goals. Some question sets might have more than one correct solution, while others might not have a correct solution.
After you answer a question in this section, you will NOT be able to return to it. As a result, these questions will not appear in the review screen.
From Power Query Editor, you profile the data shown in the following exhibit.
The IoT GUID and IoT ID columns are unique to each row in the query.
You need to analyze IoT events by the hour and day of the year. The solution must improve dataset performance.
Solution: You split the IoT DateTime column into a column named Date and a column named Time.
Does this meet the goal?
Answer:
B