HOTSPOT -
You plan to create the Power BI model shown in the exhibit. (Click the Exhibit tab.)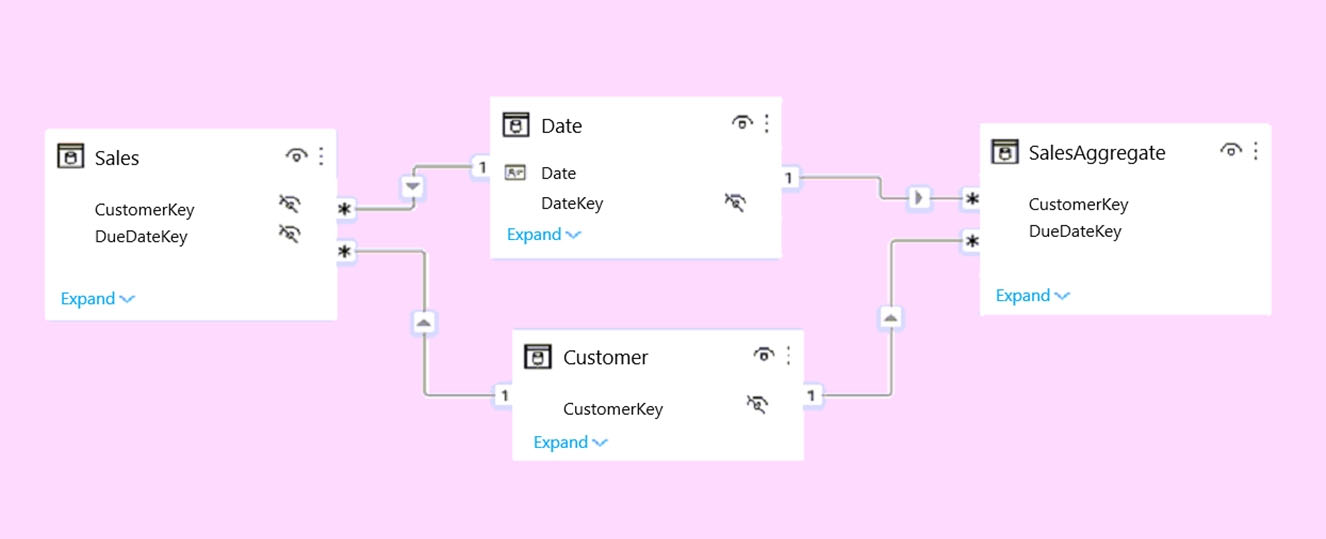
The data has the following refresh requirements:
✑ Customer must be refreshed daily.
✑ Date must be refreshed once every three years.
✑ Sales must be refreshed in near real time.
✑ SalesAggregate must be refreshed once per week.
You need to select the storage modes for the tables. The solution must meet the following requirements:
✑ Minimize the load times of visuals.
✑ Ensure that the data is loaded to the model based on the refresh requirements.
Which storage mode should you select for each table? To answer, select the appropriate options in the answer area.
NOTE: Each correct selection is worth one point.
Hot Area: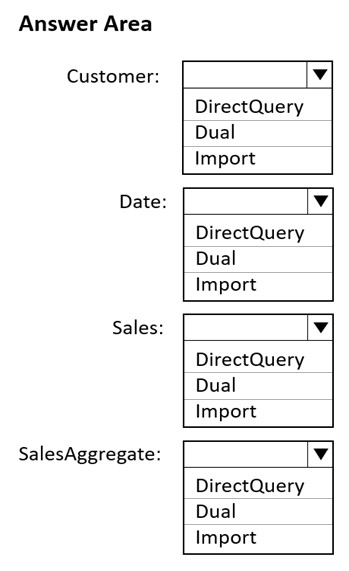
Answer:
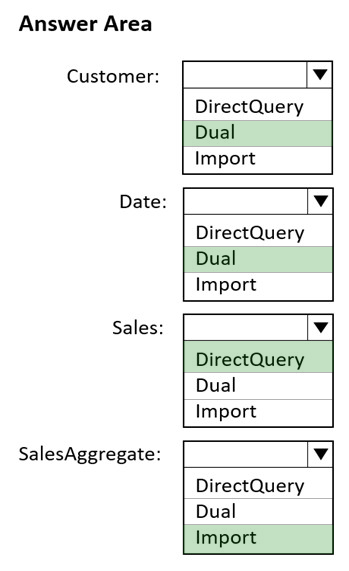
Box 1: Dual -
Customer should use the dual storage mode.
Dual: Tables with this setting can act as either cached or not cached, depending on the context of the query that's submitted to the Power BI dataset. In some cases, you fulfill queries from cached data. In other cases, you fulfill queries by executing an on-demand query to the data source.
Note: You set the Storage mode property to one of these three values: Import, DirectQuery, and Dual.
Box 2: Dual -
You can set the dimension tables (Customer, Geography, and Date) to Dual to reduce the number of limited relationships in the dataset, and improve performance.
Box 3: DirectQuery -
Sales should use the DirectQuery storage mode.
DirectQuery: Tables with this setting aren't cached. Queries that you submit to the Power BI datasetג€"for example, DAX queriesג€"and that return data from
DirectQuery tables can be fulfilled only by executing on-demand queries to the data source. Queries that you submit to the data source use the query language for that data source, for example, SQL.
Box 4: Import -
Import: Imported tables with this setting are cached. Queries submitted to the Power BI dataset that return data from Import tables can be fulfilled only from cached data.
Reference:
https://docs.microsoft.com/en-us/power-bi/transform-model/desktop-storage-mode
You have a project management app that is fully hosted in Microsoft Teams. The app was developed by using Microsoft Power Apps.
You need to create a Power BI report that connects to the project management app.
Which connector should you select?
Answer:
C
Data sources in Power BI Desktop.
The Power Platform category provides the following data connections:
Power BI datasets -
Power BI dataflows -
Common Data Service (Legacy)
Dataverse -
Dataflows -
Other data sources include Microsoft Teams Personal Analytics (Beta).
Reference:
https://docs.microsoft.com/en-us/power-bi/connect-data/desktop-data-sources
For the sales department at your company, you publish a Power BI report that imports data from a Microsoft Excel file located in a Microsoft SharePoint folder.
The data model contains several measures.
You need to create a Power BI report from the existing data. The solution must minimize development effort.
Which type of data source should you use?
Answer:
B
Connect to a SharePoint folder from Power Query Desktop
To connect to a SharePoint folder:
1. From Get Data, select SharePoint folder.
2. Paste the SharePoint site URL you copied in Determine the site URL to the Site URL text box in the SharePoint folder dialog box. In this example, the site URL is https://contoso.sharepoint.com/marketing/data. If the site URL you enter is invalid, a warning icon. warning icon will appear next to the URL text box.
Select OK to continue.
3. If this is the first time you've visited this site address, select the appropriate authentication method. Enter your credentials and choose which level to apply these settings to. Then select Connect.
4. When you select the SharePoint folder you want to use, the file information about all of the files in that SharePoint folder are displayed. In addition, file information about any files in any subfolders is also displayed.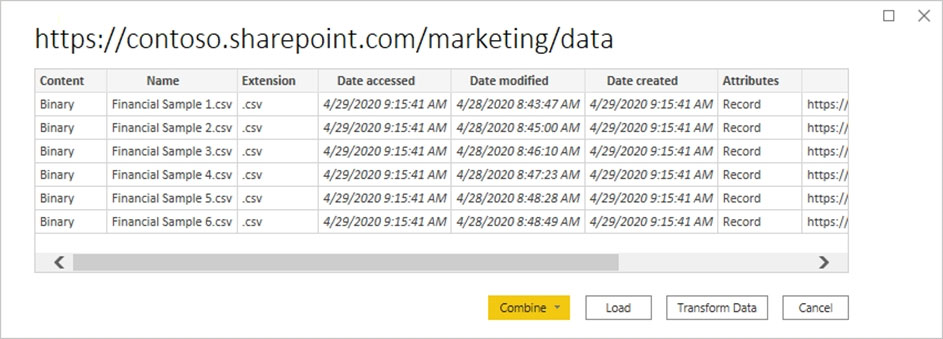
5. Etc.
Reference:
https://docs.microsoft.com/en-us/power-query/connectors/sharepointfolder
You import two Microsoft Excel tables named Customer and Address into Power Query. Customer contains the following columns:
✑ Customer ID
✑ Customer Name
✑ Phone
✑ Email Address
✑ Address ID
Address contains the following columns:
✑ Address ID
✑ Address Line 1
✑ Address Line 2
✑ City
✑ State/Region
✑ Country
✑ Postal Code
Each Customer ID represents a unique customer in the Customer table. Each Address ID represents a unique address in the Address table.
You need to create a query that has one row per customer. Each row must contain City, State/Region, and Country for each customer.
What should you do?
Answer:
A
A merge queries operation joins two existing tables together based on matching values from one or multiple columns. You can choose to use different types of joins, depending on the output you want.
Reference:
https://docs.microsoft.com/en-us/power-query/merge-queries-overview
HOTSPOT -
You have two Azure SQL databases that contain the same tables and columns.
For each database, you create a query that retrieves data from a table named Customer.
You need to combine the Customer tables into a single table. The solution must minimize the size of the data model and support scheduled refresh in powerbi.com.
What should you do? To answer, select the appropriate options in the answer area.
NOTE: Each correct selection is worth one point.
Hot Area: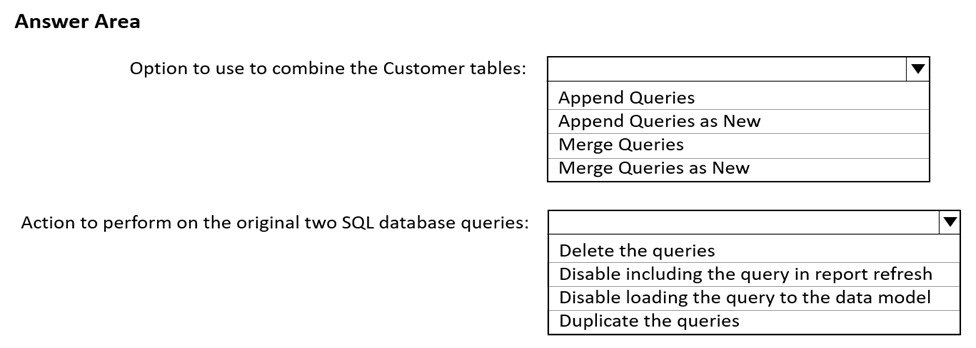
Answer:
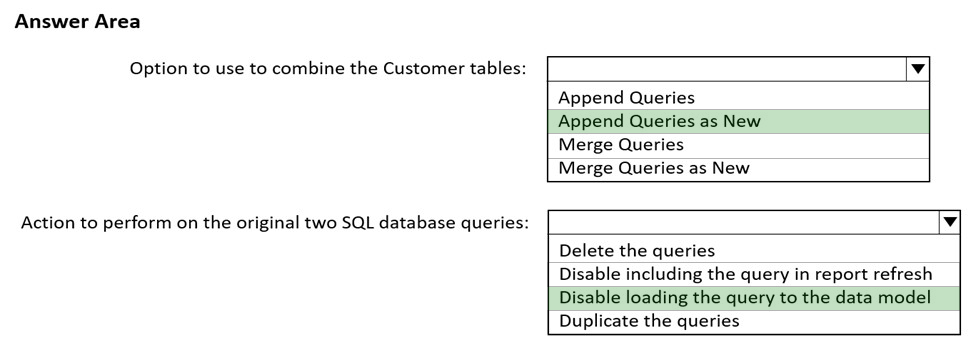
Box 1: Append Queries as New -
When you have additional rows of data that you'd like to add to an existing query, you append the query.
There are two append options:
* Append queries as new displays the Append dialog box to create a new query by appending multiple tables.
* Append queries displays the Append dialog box to add additional tables to the current query.
Incorrect: When you have one or more columns that you'd like to add to another query, you merge the queries.
Box 2: Disable loading the query to the data model
By default, all queries from Query Editor will be loaded into the memory of Power BI Model. You can disable the load for some queries, especially queries that used as intermediate transformation to produce the final query for the model.
Disabling Load doesn't mean the query won't be refreshed, it only means the query won't be loaded into the memory. When you click on Refresh model in Power
BI, or when a scheduled refresh happens even queries marked as Disable Load will be refreshed, but their data will be used as intermediate source for other queries instead of loading directly into the model. This is a very basic performance tuning tip, but very important when your Power BI model grows bigger and bigger.
Reference:
https://docs.microsoft.com/en-us/power-query/append-queries
https://radacad.com/performance-tip-for-power-bi-enable-load-sucks-memory-up
You have the tables shown in the following table.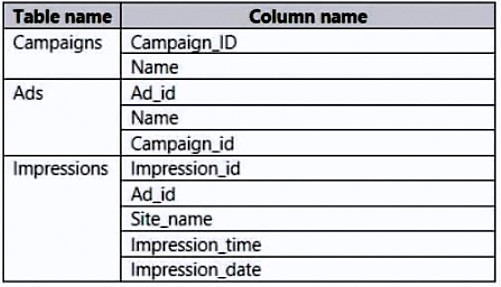
The Impressions table contains approximately 30 million records per month.
You need to create an ad analytics system to meet the following requirements:
✑ Present ad impression counts for the day, campaign, and site_name. The analytics for the last year are required.
Minimize the data model size.
Which two actions should you perform? Each correct answer presents part of the solution.
NOTE: Each correct selection is worth one point.
Answer:
AB
Incorrect:
Not C: A calculated table would increase the data model size.
Not D: Need Impression_date etc.
HOTSPOT -
You are creating a Microsoft Power BI data model that has the tables shown in the following table.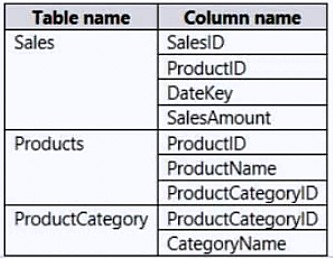
The Products table is related to the ProductCategory table through the ProductCategoryID column. Each product has one product category.
You need to ensure that you can analyze sales by product category.
How should you configure the relationship from ProductCategory to Products? To answer, select the appropriate options in the answer area.
NOTE: Each correct selection is worth one point.
Hot Area:
Answer:

Box 1: One-to-many -
The one-to-many and many-to-one cardinality options are essentially the same, and they're also the most common cardinality types.
Incorrect: A many-to-many relationship means both columns can contain duplicate values. This cardinality type is infrequently used. It's typically useful when designing complex model requirements. You can use it to relate many-to-many facts or to relate higher grain facts. For example, when sales target facts are stored at product category level and the product dimension table is stored at product level.
Box 2: Single -
Incorrect:
Bear in mind that bi-directional relationships can impact negatively on performance. Further, attempting to configure a bi-directional relationship could result in ambiguous filter propagation paths. In this case, Power BI Desktop may fail to commit the relationship change and will alert you with an error message.
Reference:
https://docs.microsoft.com/en-us/power-bi/transform-model/desktop-relationships-understand
You import a Power BI dataset that contains the following tables:
✑ Date
✑ Product
✑ Product Inventory
The Product Inventory table contains 25 million rows. A sample of the data is shown in the following table.
The Product Inventory table relates to the Date table by using the DateKey column. The Product Inventory table relates to the Product table by using the
ProductKey column.
You need to reduce the size of the data model without losing information.
What should you do?
Answer:
A
The DateKey and MovementDate columns have the same information. Movementdate can be removed.
Incorrect:
Not C: Integer data type would lose data.
HOTSPOT -
You are enhancing a Power BI model that has DAX calculations.
You need to create a measure that returns the year-to-date total sales from the same date of the previous calendar year.
Which DAX functions should you use? To answer, select the appropriate options in the answer area.
NOTE: Each correct selection is worth one point.
Hot Area: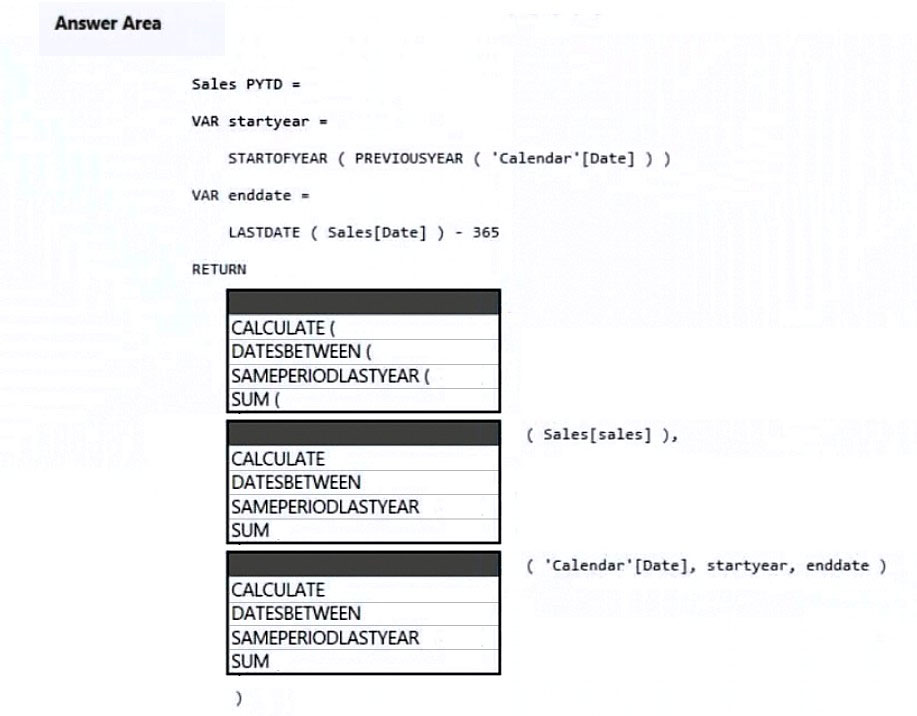
Answer:
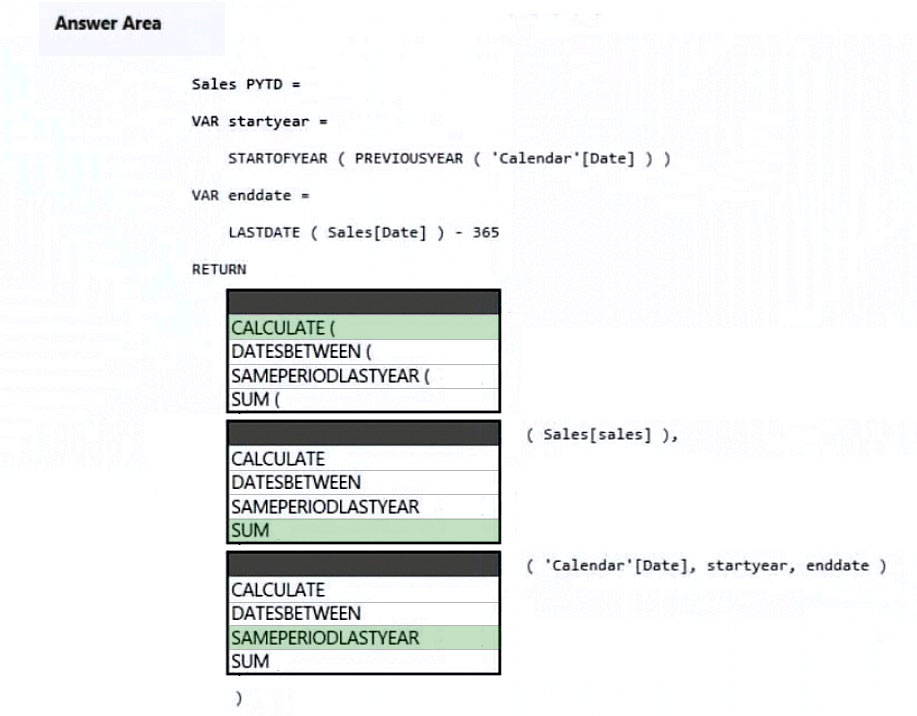
Box 1: CALCULATE -
Example:
Total sales on the last selected date =
CALCULATE (
SUM ( Sales[Sales Amount] ),
'Sales'[OrderDateKey] = MAX ( 'Sales'[OrderDateKey] )
)
Box 2: SUM -
Box 3: SAMEPERIODLASTYEAR -
SAMEPERIODLASTYEAR returns a set of dates in the current selection from the previous year.
Example:
-- SAMEPERIODLASTYEAR returns the selected period shifted back one year.
EVALUATE -
VAR StartDate = DATE ( 2008, 07, 25 )
VAR EndDate = DATE ( 2008, 07, 31 )
RETURN -
CALCULATETABLE (
SAMEPERIODLASTYEAR ( 'Date'[Date] ),
'Date'[Date] >= StartDate &&
'Date'[Date] <= EndDate
)
ORDER BY [Date]
Reference:
https://docs.microsoft.com/en-us/dax/calculate-function-dax
https://dax.guide/sameperiodlastyear/
Note: This question is part of a series of questions that present the same scenario. Each question in the series contains a unique solution that might meet the stated goals. Some question sets might have more than one correct solution, while others might not have a correct solution.
After you answer a question in this section, you will NOT be able to return to it. As a result, these questions will not appear in the review screen.
You are modeling data by using Microsoft Power BI. Part of the data model is a large Microsoft SQL Server table named Order that has more than 100 million records.
During the development process, you need to import a sample of the data from the Order table.
Solution: You add a report-level filter that filters based on the order date.
Does this meet the goal?
Answer:
B
You want the raw data, not a report with the data.
Instead add a WHERE clause to the SQL statement.
Reference:
https://docs.microsoft.com/en-us/power-query/native-database-query