Note: This question is part of a series of questions that present the same scenario. Each question in the series contains a unique solution that might meet the stated goals. Some question sets might have more than one correct solution, while others might not have a correct solution.
After you answer a question in this section, you will NOT be able to return to it. As a result, these questions will not appear in the review screen.
A company has locations in multiple countries and regions across four continents.
The company stores the total amount of each order in the local currency of the country/region where the customer is located. The company stores the applicable exchange rates in a custom US dollars (USD) exchange rate table.
You need to create a visualization that displays the total amount of orders by country/region in USD.
Proposed solution:
Create a custom rollup field of type currency on the country/region table that aggregates all the total amounts for the orders from that country/region and display this rollup field in a Power BI chart.
Does the solution meet the goal?
Answer:
B
Instead use a calculated field.
Need to calculate the exchange rate in USD.
Calculated columns are calculated in real-time when they are retrieved.
Reference:
https://docs.microsoft.com/en-us/powerapps/developer/data-platform/calculated-rollup-attributes
Note: This question is part of a series of questions that present the same scenario. Each question in the series contains a unique solution that might meet the stated goals. Some question sets might have more than one correct solution, while others might not have a correct solution.
After you answer a question in this section, you will NOT be able to return to it. As a result, these questions will not appear in the review screen.
A company has locations in multiple countries and regions across four continents.
The company stores the total amount of each order in the local currency of the country/region where the customer is located. The company stores the applicable exchange rates in a custom US dollars (USD) exchange rate table.
You need to create a visualization that displays the total amount of orders by country/region in USD.
Proposed solution:
Create a custom calculated field of type currency on the order table that converts the order total to USD and displays the total amounts by region in a Power BI chart.
Does the solution meet the goal?
Answer:
A
Instead use a calculated field.
Need to calculate the exchange rate in USD.
Calculated columns are calculated in real-time when they are retrieved.
Reference:
https://docs.microsoft.com/en-us/powerapps/developer/data-platform/calculated-rollup-attributes
HOTSPOT -
A company is building a Power Apps app to track key project tasks.
Users assign tasks a risk status on a scale of 0 to 100 by using a slider input control named RiskStatus on the app. The highest risks use the risk status value of
100.
For each task, the user selects a button named RiskLevel to send the name of the task and RiskStatus number to key project stakeholders. The color of the button must change to the color listed in the following table based on the value of the RiskStatus control. The default color for the button is green.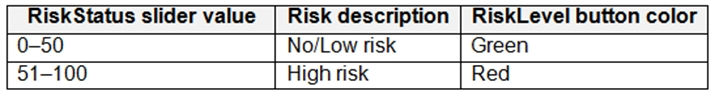
You need to configure the solution to change the color of the RiskLevel button.
How should you configure the app? To answer, select the appropriate options in the answer area.
NOTE: Each correct selection is worth one point.
Hot Area: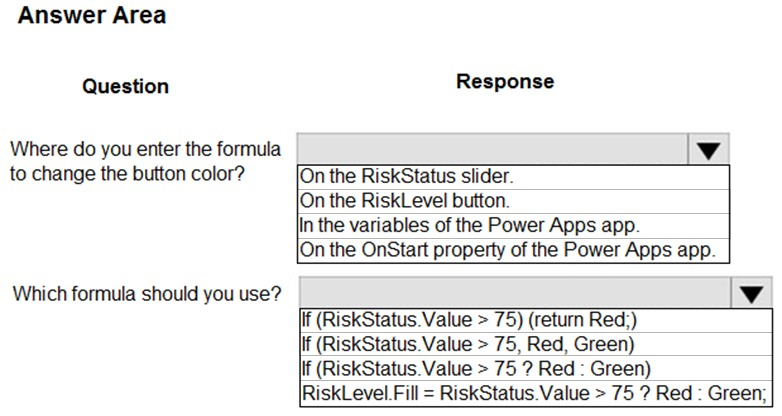
Answer:
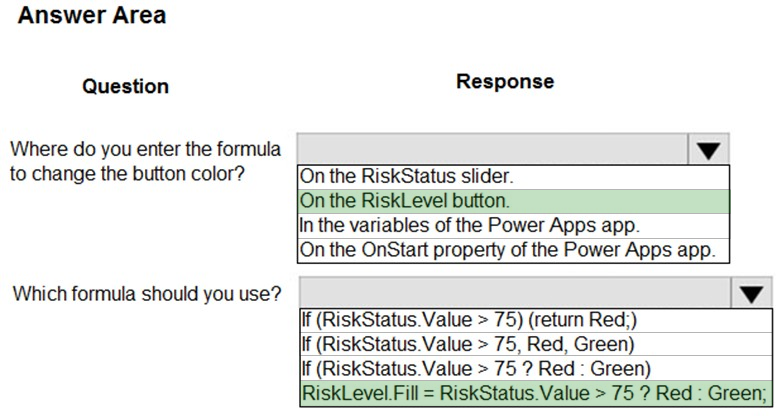
Box 1: On the RiskLevel button.
On the RiskLevel button fill property.
Box 2: Risklevel.Fill = RiskStatus.Value > 75 ? Red : Green;
Most every type of control in a Power App, has a Fill property, for the fill color.
Reference:
https://wonderlaura.com/2020/07/23/power-apps-gallery-conditional-formatting/
HOTSPOT -
A company creates a Power Apps app that allows service representatives to record information about on-site client visits. Service representatives perform a one- hour site visit with each client each quarter.
Service representatives use the app to perform the following activities:
✑ View their scheduled visits for the day.
✑ Record notes from service visits.
✑ Schedule service technicians for issues uncovered during site visits.
✑ Scan and upload service quote forms to a folder named Service Quote folder on Microsoft OneDrive once the customer has signed a service quote.
Service quotes that are over $10,000 are automatically sent to the service manager for review and approval.
Visits that are not closed at the end of the day are automatically moved to the following day unless it is the last day of the quarter. All client visits not performed for the quarter are escalated to the service manager for follow-up.
You need to create flows to meet the requirements.
Which type of flows should you use? To answer, select the appropriate options in the answer area.
NOTE: Each correct selection is worth one point.
Hot Area: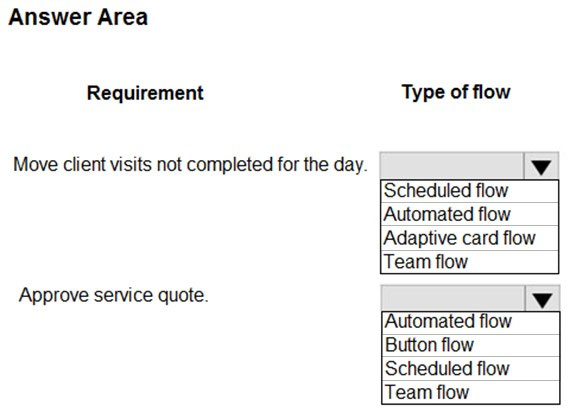
Answer:
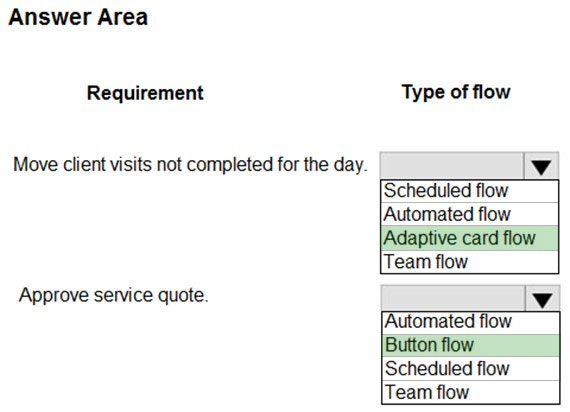
Box 1: Adaptive card flow -
Adaptive Cards are a platform-agnostic method of sharing and displaying blocks of information without the complexity of customizing CSS or HTML to render them.
Directing content to Teams channels:
Post your own adaptive card as the Flow bot to a channel
This action posts an adaptive card as a Flow bot to a specific Teams channel. In this case, you will be prompted for Teams instance, and a channel where the card will be posted. The flow-maker will have to have access to the Teams instance in order to post an adaptive card there. In this case, only URL buttons function by redirecting to the URL configured within the flow.
Box 2: Button flow -
Create a button flow to run routine tasks by simply tapping a button. Customize your flow by allowing the user to provide specific details that will be used when the flow runs.
Reference:
https://docs.microsoft.com/en-us/power-automate/overview-adaptive-cards https://docs.microsoft.com/en-us/power-automate/button-flow-with-user-input-tokens
You complete work on a new canvas app in a development environment and add the app to a solution. You export the solution from the development environment and import the solution into a production environment.
After several days you notice that the background color for the canvas app in the production environment has changed from white to gray.
You need to determine why the background color changed.
What are two possible causes for the background color change? Each correct answer presents a complete solution.
NOTE: Each correct selection is worth one point.
Answer:
AC
A: You can create a custom look and feel (a theme), for your app by making changes to the default colors and visual elements provided in the uncustomized system.
C: Unmanaged Solution: The beginning state of solution is the unmanaged solution state. During this phase, you can add, edit, update, remove, delete, and test any of the components of the solution. You also have the ability to create restrictions on the components within the solution.
Note: Managed Solution: A managed solution is a finalized solution that can be distributed and installed. They are created by exporting an unmanaged solution by setting restrictions to prevent any further customizations. The whole point of Managed is locking down the Component states so they cannot be edited.
Reference:
https://powerusers.microsoft.com/t5/Power-Apps-Pro-Dev-ISV/Managed-vs-Unmanaged/td-p/495685 https://docs.microsoft.com/en-us/powerapps/maker/model-driven-apps/create-themes-organization-branding
DRAG DROP -
You create a canvas app for a store.
The logo must appear as the background image for the app. A loading spinner must display on the screen as the app loads.
You need to add the features to the app.
What should you modify? To answer, drag the appropriate form areas to the correct requests. Each form area may be used once, more than once, or not at all.
You may need to drag the split bar between panes or scroll to view content.
NOTE: Each correct selection is worth one point.
Select and Place: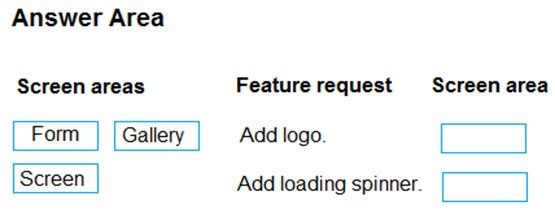
Answer:
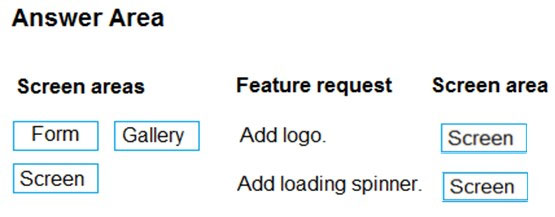
Box 1: Screen -
You can add an image to a screen in several different ways. One way is to upload an image to the app, go to the Media tab, and then click on the image to add it to a screen.
Note: Configure graphical elements in your app, including images, photos, and elements of a pen control.
BackgroundImage ג€" The name of an image file that appears in the background of a screen.
Applies to the Screen control.
Box 2: Screen -
Out Of Box Canvas App, provide a property called LoadingSpinner and LoadingSpinnerColor.
LoadingSpinner property is used to displaying a Canvas App OOB Loader Image unless your screen finishes loading.
Click on the Screen in your Canvas App and then You'll be able to see LoadingSpinner and LoadingSpinnerColor Property.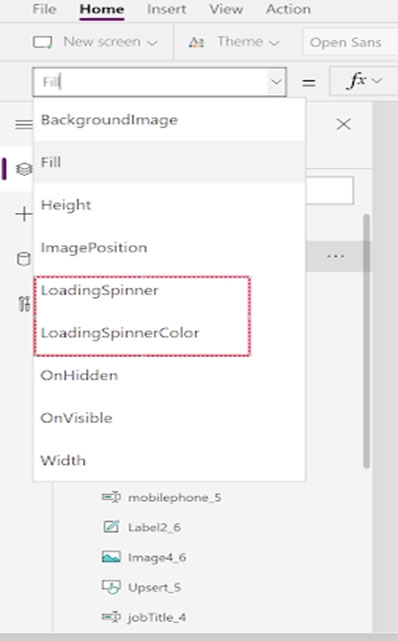
Reference:
https://docs.microsoft.com/en-us/powerapps/maker/canvas-apps/controls/properties-visual https://arpitmscrmhunt.blogspot.com/2020/04/powerapps-display-loading-icon-until.html
You have a Power Automate flow that processes files in a Microsoft SharePoint document library. The flow only needs to be run as required. You add steps to the flow to process the files.
Before leaving the office for the day, the manager must initiate the flow. The flow must not start processing files before 11:00 PM.
You need to configure the flow.
Which two actions should you perform? Each correct answer presents part of the solution.
NOTE: Each correct selection is worth one point.
Answer:
CD
Delay an action until a specific timestamp.
Note: The Microsoft Dataverse connector provides four ways to add wait conditions. Use these wait conditions when you need to delay processing in your flows until a particular condition is met.
✑ Postpone triggering the flow and the first action until a specific time: Wait condition using Postpone Until.
✑ Add a fixed delay before the next step.
✑ Delay an action until a specific timestamp.
✑ Delay an action until a specific event occurs.
Reference:
https://docs.microsoft.com/en-us/power-automate/dataverse/wait-conditions
DRAG DROP -
You are creating a model-driven app for onboarding new employees.
You need to implement business logic for the app.
Which tool should you use? To answer, drag the appropriate tools to the correct requirements. Each tool may be used once, more than once, or not at all. You may need to drag the split bar between panes or scroll to view content.
NOTE: Each correct selection is worth one point.
Select and Place: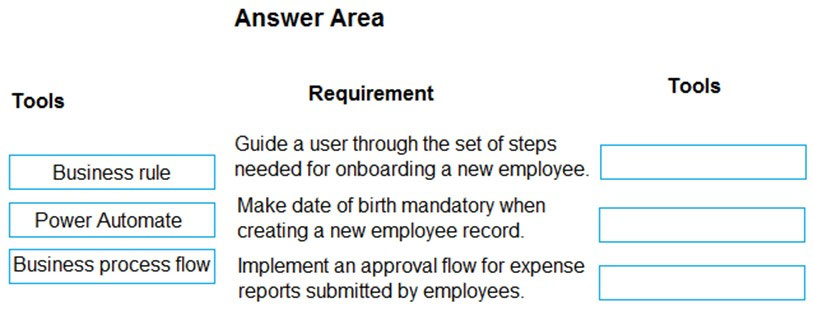
Answer:
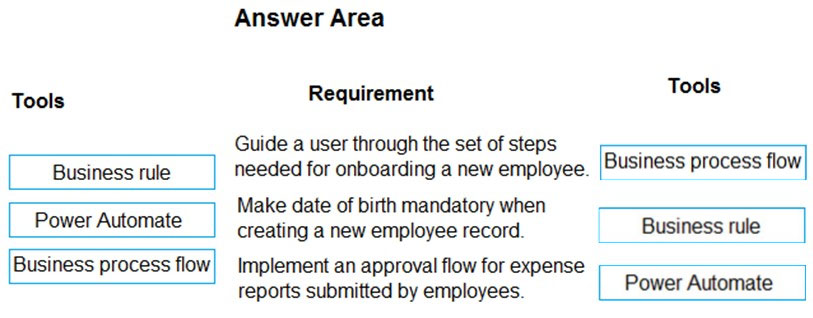
Box 1: Business process flow -
A business process flow is a visual guide meant to help users complete a business process by using a set of predefined stages. Users are not limited on how long they run a business process or how long they have a stage open.
Box 2: Business rule -
Box 3: Power Automate -
A Power Automate flow does not have any visual components like a business process flow. Power Automate flows can be configured to work with many different data sources, and a flow can connect to many different data sources within the same flow. A flow can be configured to time out if it is not completed in a certain time and can be triggered to move between steps based on data or user interaction.
Reference:
https://docs.microsoft.com/en-us/learn/modules/intro-business-process-flows/2-differences
HOTSPOT -
You create a canvas app for a service company.
Using the Tree view, you navigate to the ViewServices screen. The screen contains a form named DetailForm1 that only contains Label controls. You add the
People icon to the header of the ViewServices screen as shown below: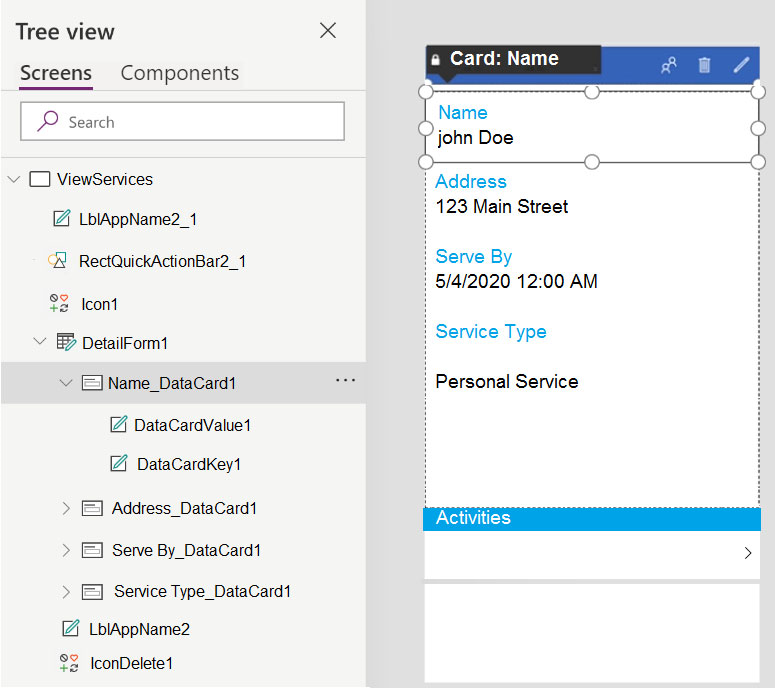
When you select the icon a new Activity form opens. You must set the value of the Name field on the new Activity form to the value of the name field from
DetailForm1.
Use the drop-down menus to select the answer choice that answers each question based on the information presented in the graphic.
NOTE: Each correct selection is worth one point.
Hot Area: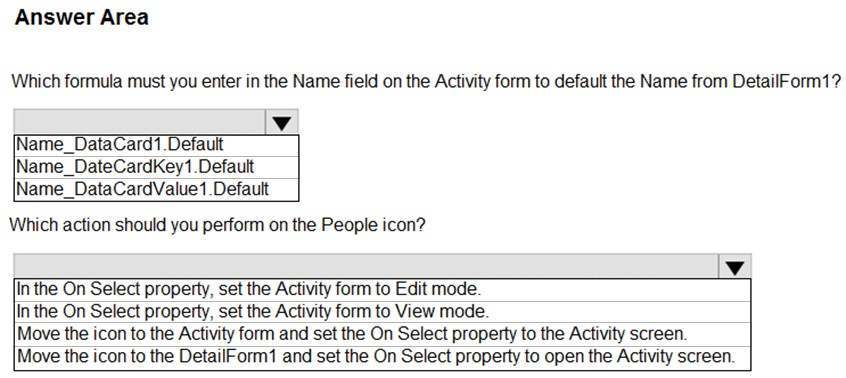
Answer:
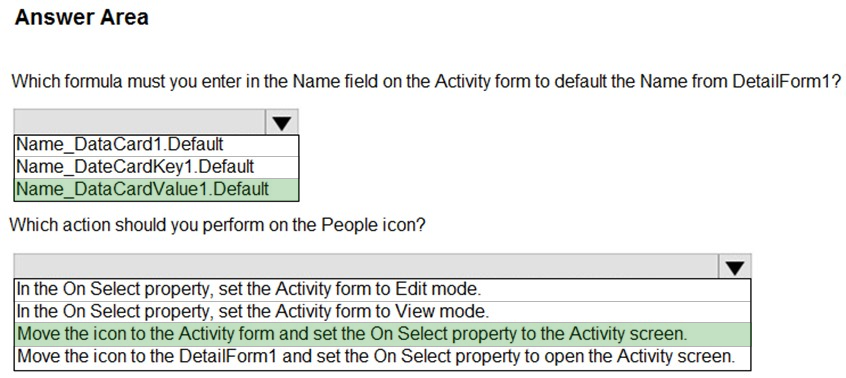
Box 1: Name_DataCardValue1.Default
Box 2: Move the icon to the Activity form and set the On Select property to the Activity screen.
The Select function simulates a select action on a control as if the user had clicked or tapped the control. As a result, the OnSelect formula on the target control is evaluated.
Reference:
https://docs.microsoft.com/en-us/powerapps/maker/canvas-apps/functions/function-select
You are creating a canvas app for a company that delivers packages. The app will display one screen for each delivery attempt.
Drivers must make three attempts to deliver a package before returning the package back to a warehouse. Drivers must enter details about delivery on a second screen in the app.
You need to display a list of delivery attempts on the delivery screen.
Which two components can you add to the app to display details about the delivery attempts? Each correct answer presents a complete solution.
NOTE: Each correct selection is worth one point.
Answer:
AC
The Data table control shows a dataset.
In a canvas app, add and configure a Display form control to show all fields in a record.
Reference:
https://docs.microsoft.com/en-us/powerapps/maker/canvas-apps/controls/control-data-table https://docs.microsoft.com/en-us/powerapps/maker/canvas-apps/working-with-form-layout