You have an Azure SQL managed instance.
You need to gather the last execution of a query plan and its runtime statistics. The solution must minimize the impact on currently running queries.
What should you do?
Answer:
C
Reference:
https://docs.microsoft.com/en-us/sql/relational-databases/system-dynamic-management-views/sys-dm-exec-query-plan-stats-transact-sql?view=sql-server-ver15
HOTSPOT -
You have an Azure SQL database named db1 on a server named server1.
You use Query Performance Insight to monitor db1.
You need to modify the Query Store configuration to ensure that performance monitoring data is available as soon as possible.
Which configuration setting should you modify and which value should you configure? To answer, select the appropriate options in the answer area.
NOTE: Each correct selection is worth one point.
Hot Area: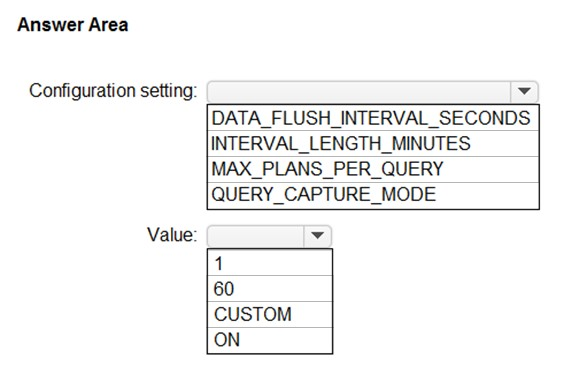
Answer:
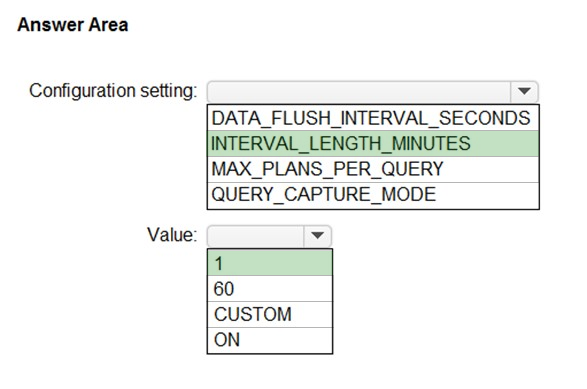
Box 1: INTERVAL_LENGTH_MINUTES -
INTERVAL_LENGTH_MINUTES defines size of time window during which collected runtime statistics for query plans are aggregated and persisted. Every active query plan has at most one row for a period of time defined with this configuration.
Default: 60 -
Box 2: 1 -
Statistics Collection Interval (INTERVAL_LENGTH_MINUTES): Defines the level of granularity for the collected runtime statistic, expressed in minutes. The default is 60 minutes. Consider using a lower value if you require finer granularity or less time to detect and mitigate issues.
Use SQL Server Management Studio or Transact-SQL to set a different value for Statistics Collection Interval:
ALTER DATABASE [QueryStoreDB]
SET QUERY_STORE (INTERVAL_LENGTH_MINUTES = 60);
Reference:
https://docs.microsoft.com/en-us/sql/relational-databases/performance/best-practice-with-the-query-store
You have an Azure SQL Database managed instance.
The instance starts experiencing performance issues.
You need to identify which query is causing the issue and retrieve the execution plan for the query. The solution must minimize administrative effort.
What should you use?
Answer:
D
Use the dynamic management view sys.dm_exec_requests to track currently executing queries and the associated worker time.
Incorrect:
Not C: DMVs that track Query Store and wait statistics show results for only successfully completed and timed-out queries.
Reference:
https://docs.microsoft.com/en-us/azure/azure-sql/identify-query-performance-issues
You have an Azure SQL database named DB1.
You need to display the estimated execution plan of a query by using the query editor in the Azure portal.
What should you do first?
Answer:
A
The SET SHOWPLAN_ALL command causes Microsoft SQL Server not to execute Transact-SQL statements. Instead, SQL Server returns detailed information about how the statements are executed and provides estimates of the resource requirements for the statements.
Reference:
https://docs.microsoft.com/en-us/sql/t-sql/statements/set-showplan-all-transact-sql?view=sql-server-ver15
HOTSPOT -
You have an Azure SQL database.
You have a query and the associated execution plan as shown in the following exhibit.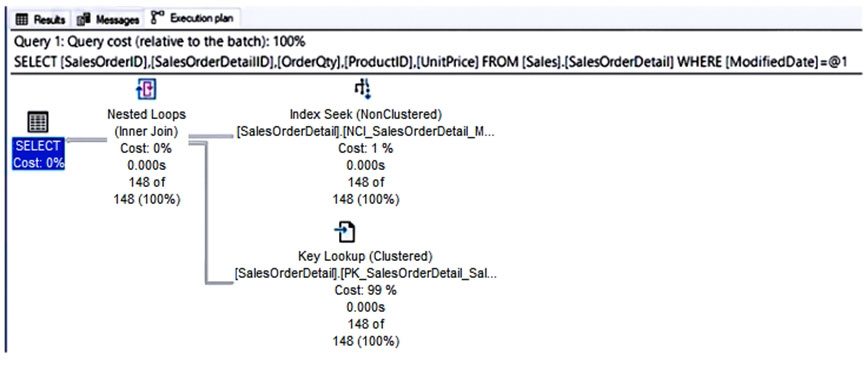
Use the drop-down menus to select the answer choice that completes each statement based on the information presented in the graphic.
NOTE: Each correct selection is worth one point.
Hot Area: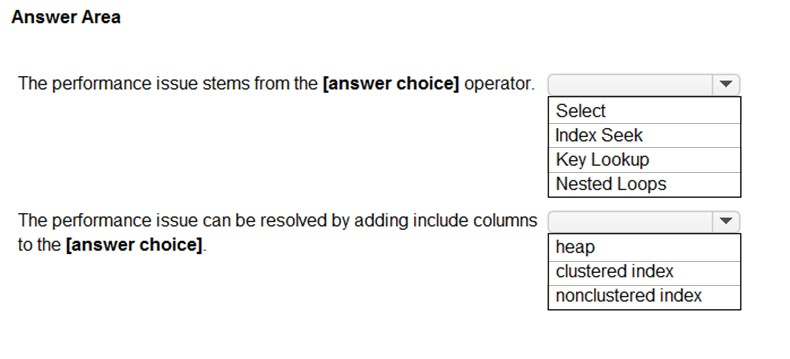
Answer:
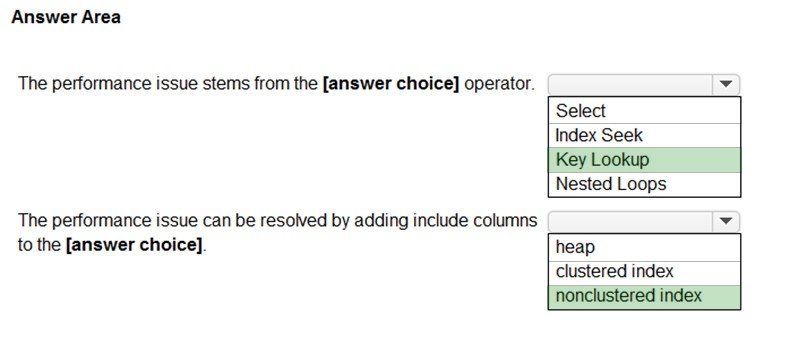
Box 1: Key Lookup -
The Key Lookup cost is 99% so that is the performance bottleneck.
Box 2: nonclustered index -
The key lookup on the clustered index is used because the nonclustered index does not include the required columns to resolve the query. If you add the required columns to the nonclustered index, the key lookup will not be required.
You have an instance of SQL Server on Azure Virtual Machines that has a database named DB1.
You plan to implement Azure SQL Data Sync for DB1.
Which isolation level should you configure?
Answer:
B
Data Sync general requirements include:
* Snapshot isolation must be enabled for both Sync members and hub.
Reference:
https://docs.microsoft.com/en-us/azure/azure-sql/database/sql-data-sync-data-sql-server-sql-database
HOTSPOT -
You have SQL Server on an Azure virtual machine.
You review the query plan shown in the following exhibit.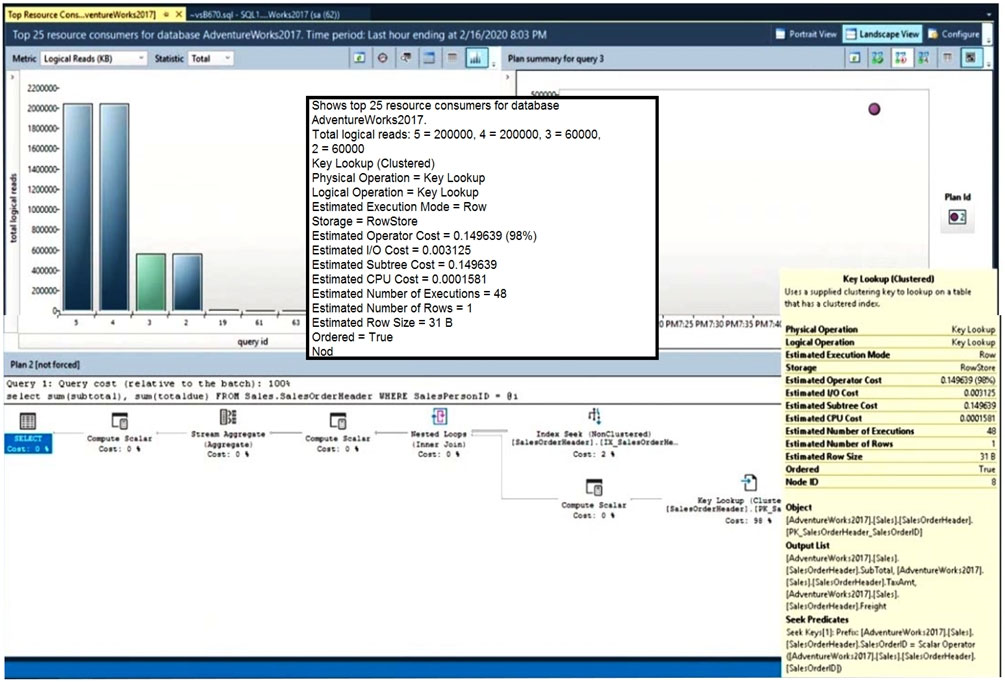
For each of the following statements, select yes if the statement is true. Otherwise, select no.
NOTE: Each correct selection is worth one point.
Hot Area: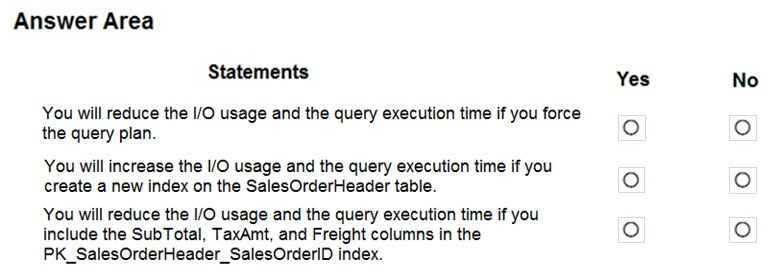
Answer:
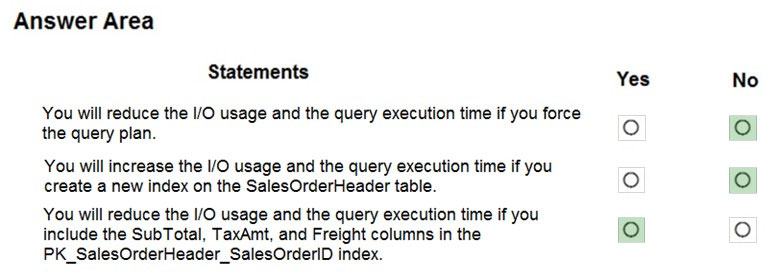
Box 1: No -
There is only one query plan available. Force has no effect.
Box 2: No -
Adding an index will not increase IO usage.
Box 3: Yes -
The performance would improve.
Reference:
https://docs.microsoft.com/en-us/sql/relational-databases/performance/monitoring-performance-by-using-the-query-store
A data engineer creates a table to store employee information for a new application. All employee names are in the US English alphabet. All addresses are locations in the United States. The data engineer uses the following statement to create the table.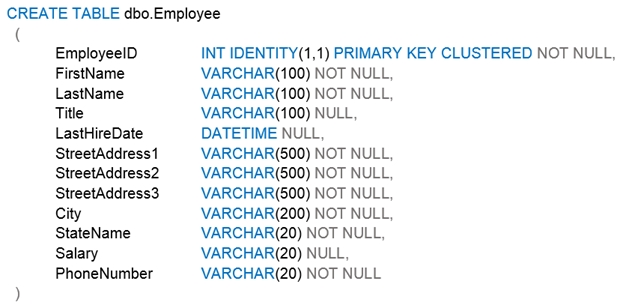
You need to recommend changes to the data types to reduce storage and improve performance.
Which two actions should you recommend? Each correct answer presents part of the solution.
NOTE: Each correct selection is worth one point.
Answer:
AE
A: Money takes less space compared to VARCHAR(20)
E: Date takes less space compared to Datetime.
Reference:
https://docs.microsoft.com/eN-Us/sql/t-sql/data-types/data-types-transact-sql
You have an Azure SQL database.
You identify a long running query.
You need to identify which operation in the query is causing the performance issue.
What should you use to display the query execution plan in Microsoft SQL Server Management Studio (SSMS)?
Answer:
A
SQL Server Management Studio provides the ability to view the live execution plan of an active query. This live query plan provides real-time insights into the query execution process as the controls flow from one query plan operator to another. The live query plan displays the overall query progress and operator-level run-time execution statistics such as the number of rows produced, elapsed time, operator progress, etc. Because this data is available in real time without needing to wait for the query to complete, these execution statistics are extremely useful for debugging query performance issues.
Reference:
https://docs.microsoft.com/en-us/sql/relational-databases/performance/live-query-statistics
You have a version-8.0 Azure Database for MySQL database.
You need to identify which database queries consume the most resources.
Which tool should you use?
Answer:
A
The Query Store feature in Azure Database for MySQL provides a way to track query performance over time. Query Store simplifies performance troubleshooting by helping you quickly find the longest running and most resource-intensive queries. Query Store automatically captures a history of queries and runtime statistics, and it retains them for your review. It separates data by time windows so that you can see database usage patterns. Data for all users, databases, and queries is stored in the mysql schema database in the Azure Database for MySQL instance.
Reference:
https://docs.microsoft.com/en-us/azure/mysql/concepts-query-store