HOTSPOT -
You are debugging an application that is running on Azure Kubernetes cluster named cluster1. The cluster uses Azure Monitor for containers to monitor the cluster.
The application has sticky sessions enabled on the ingress controller.
Some customers report a large number of errors in the application over the last 24 hours.
You need to determine on which virtual machines (VMs) the errors are occurring.
How should you complete the Azure Monitor query? To answer, select the appropriate options in the answer area.
NOTE: Each correct selection is worth one point.
Hot Area: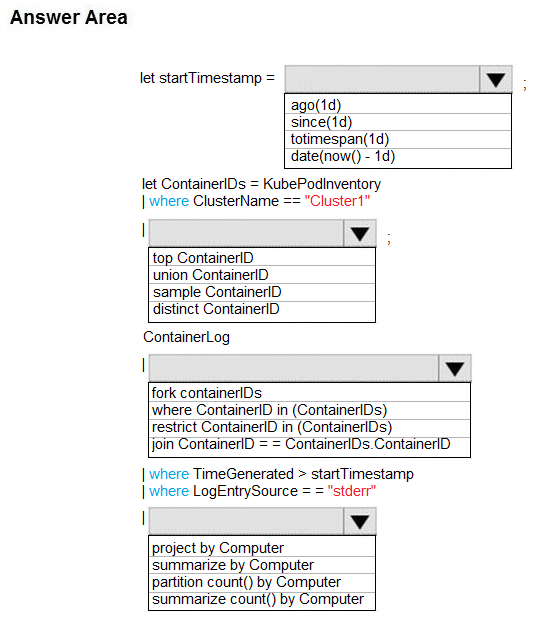
Answer:
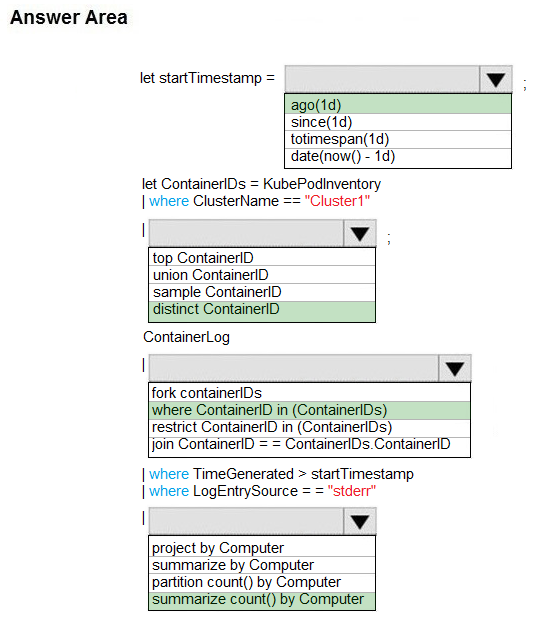
Box 1: ago(1d)
Box 2: distinct containerID -
Box 3: where ContainerID in (ContainerIDs)
Box 4: summarize Count by Computer
Summarize: aggregate groups of rows
Use summarize to identify groups of records, according to one or more columns, and apply aggregations to them. The most common use of summarize is count, which returns the number of results in each group.
Reference:
https://docs.microsoft.com/en-us/azure/azure-monitor/log-query/get-started-queries https://docs.microsoft.com/en-us/azure/azure-monitor/log-query/query-optimization
HOTSPOT -
You plan to deploy a web app to App Service on Linux. You create an App Service plan. You create and push a custom Docker image that contains the web app to Azure Container Registry.
You need to access the console logs generated from inside the container in real-time.
How should you complete the Azure CLI command? To answer, select the appropriate options in the answer area.
NOTE: Each correct selection is worth one point.
Hot Area: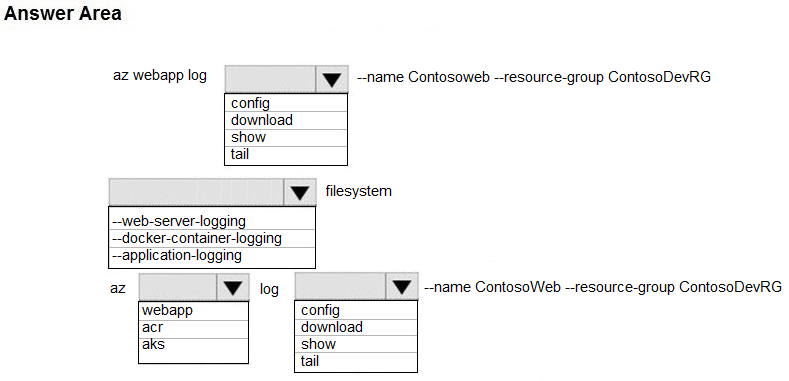
Answer:
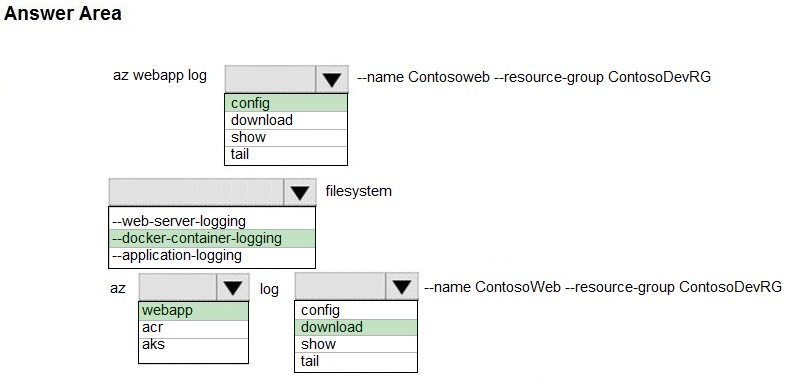
Box 1: config -
To Configure logging for a web app use the command:
az webapp log config
Box 2: --docker-container-logging
Syntax include:
az webapp log config [--docker-container-logging {filesystem, off}]
Box 3: webapp -
To download a web app's log history as a zip file use the command: az webapp log download
Box 4: download -
Reference:
https://docs.microsoft.com/en-us/cli/azure/webapp/log
You develop and deploy an ASP.NET web app to Azure App Service. You use Application Insights telemetry to monitor the app.
You must test the app to ensure that the app is available and responsive from various points around the world and at regular intervals. If the app is not responding, you must send an alert to support staff.
You need to configure a test for the web app.
Which two test types can you use? Each correct answer presents a complete solution.
NOTE: Each correct selection is worth one point.
Answer:
BC
There are three types of availability tests:
✑ URL ping test: a simple test that you can create in the Azure portal.
✑ Multi-step web test: A recording of a sequence of web requests, which can be played back to test more complex scenarios. Multi-step web tests are created in
Visual Studio Enterprise and uploaded to the portal for execution.
✑ Custom Track Availability Tests: If you decide to create a custom application to run availability tests, the TrackAvailability() method can be used to send the results to Application Insights.
Reference:
https://docs.microsoft.com/en-us/azure/azure-monitor/app/monitor-web-app-availability
DRAG DROP -
A web service provides customer summary information for e-commerce partners. The web service is implemented as an Azure Function app with an HTTP trigger.
Access to the API is provided by an Azure API Management instance. The API Management instance is configured in consumption plan mode. All API calls are authenticated by using OAuth.
API calls must be cached. Customers must not be able to view cached data for other customers.
You need to configure API Management policies for caching.
How should you complete the policy statement?
Select and Place:
Answer:

Box 1: internal -
caching-type
Choose between the following values of the attribute:
✑ internal to use the built-in API Management cache,
✑ external to use the external cache as Azure Cache for Redis prefer-external to use external cache if configured or internal cache otherwise.
Box 2: private -
downstream-caching-type
This attribute must be set to one of the following values.
✑ none - downstream caching is not allowed.
✑ private - downstream private caching is allowed.
✑ public - private and shared downstream caching is allowed.
Box 3: Authorization -
<vary-by-header>Authorization</vary-by-header>
<!-- should be present when allow-private-response-caching is "true"-->
Note: Start caching responses per value of specified header, such as Accept, Accept-Charset, Accept-Encoding, Accept-Language, Authorization, Expect, From,
Host, If-Match -
Reference:
https://docs.microsoft.com/en-us/azure/api-management/api-management-caching-policies
You are developing applications for a company. You plan to host the applications on Azure App Services.
The company has the following requirements:
✑ Every five minutes verify that the websites are responsive.
✑ Verify that the websites respond within a specified time threshold. Dependent requests such as images and JavaScript files must load properly.
✑ Generate alerts if a website is experiencing issues.
✑ If a website fails to load, the system must attempt to reload the site three more times.
You need to implement this process with the least amount of effort.
What should you do?
Answer:
D
You can monitor a recorded sequence of URLs and interactions with a website via multi-step web tests.
Incorrect Answers:
A: Selenium is an umbrella project for a range of tools and libraries that enable and support the automation of web browsers.
It provides extensions to emulate user interaction with browsers, a distribution server for scaling browser allocation, and the infrastructure for implementations of the W3C WebDriver specification that lets you write interchangeable code for all major web browsers.
Reference:
https://docs.microsoft.com/en-us/azure/azure-monitor/app/availability-multistep
You develop and add several functions to an Azure Function app that uses the latest runtime host. The functions contain several REST API endpoints secured by using SSL. The Azure Function app runs in a Consumption plan.
You must send an alert when any of the function endpoints are unavailable or responding too slowly.
You need to monitor the availability and responsiveness of the functions.
What should you do?
Answer:
B
You can create an Azure Function with TrackAvailability() that will run periodically according to the configuration given in TimerTrigger function with your own business logic. The results of this test will be sent to your Application Insights resource, where you will be able to query for and alert on the availability results data.
This allows you to create customized tests similar to what you can do via Availability Monitoring in the portal. Customized tests will allow you to write more complex availability tests than is possible using the portal UI, monitor an app inside of your Azure VNET, change the endpoint address, or create an availability test even if this feature is not available in your region.
Reference:
https://docs.microsoft.com/en-us/azure/azure-monitor/app/availability-azure-functions
DRAG DROP -
You are developing an application to retrieve user profile information. The application will use the Microsoft Graph SDK.
The app must retrieve user profile information by using a Microsoft Graph API call.
You need to call the Microsoft Graph API from the application.
In which order should you perform the actions? To answer, move all actions from the list of actions to the answer area and arrange them in the correct order.
Select and Place:
Answer:

Step 1: Register the application with the Microsoft identity platform.
To authenticate with the Microsoft identity platform endpoint, you must first register your app at the Azure app registration portal
Step 2: Build a client by using the client app ID
Step 3: Create an authentication provider
Create an authentication provider by passing in a client application and graph scopes.
Code example:
DeviceCodeProvider authProvider = new DeviceCodeProvider(publicClientApplication, graphScopes);
// Create a new instance of GraphServiceClient with the authentication provider.
GraphServiceClient graphClient = new GraphServiceClient(authProvider);
Step 4: Create a new instance of the GraphServiceClient
Step 5: Invoke the request to the Microsoft Graph API
Reference:
https://docs.microsoft.com/en-us/graph/auth-v2-service
https://docs.microsoft.com/en-us/graph/sdks/create-client
DRAG DROP -
You develop and deploy an Azure Logic App that calls an Azure Function app. The Azure Function App includes an OpenAPI (Swagger) definition and uses an
Azure Blob storage account. All resources are secured by using Azure Active Directory (Azure AD).
The Logic App must use Azure Monitor logs to record and store information about runtime data and events. The logs must be stored in the Azure Blob storage account.
You need to set up Azure Monitor logs and collect diagnostics data for the Azure Logic App.
Which three actions should you perform in sequence? To answer, move the appropriate actions from the list of actions to the answer area and arrange them in the correct order.
Select and Place: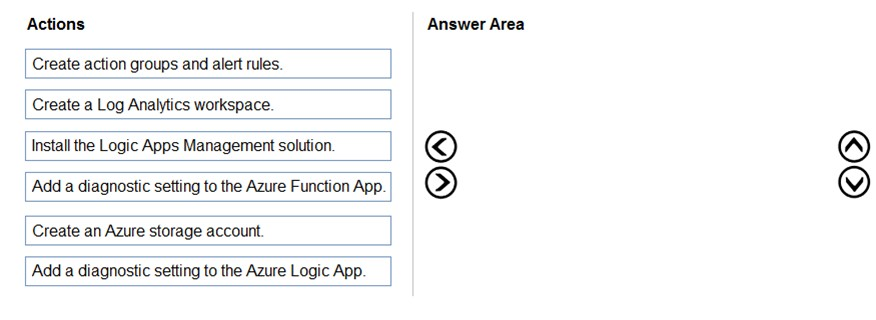
Answer:
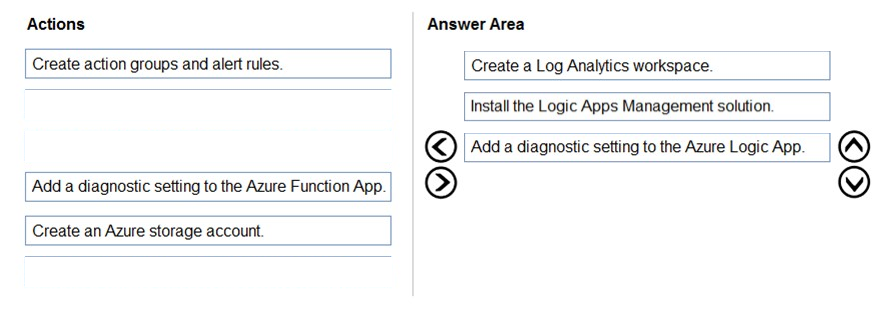
Step 1: Create a Log Analytics workspace
Before you start, you need a Log Analytics workspace.
Step 2: Install the Logic Apps Management solution
To set up logging for your logic app, you can enable Log Analytics when you create your logic app, or you can install the Logic Apps Management solution in your
Log Analytics workspace for existing logic apps.
Step 3: Add a diagnostic setting to the Azure Logic App
Set up Azure Monitor logs -
1. In the Azure portal, find and select your logic app.
2. On your logic app menu, under Monitoring, select Diagnostic settings > Add diagnostic setting.
Reference:
https://docs.microsoft.com/en-us/azure/logic-apps/monitor-logic-apps-log-analytics
DRAG DROP -
You develop an application. You plan to host the application on a set of virtual machines (VMs) in Azure.
You need to configure Azure Monitor to collect logs from the application.
Which four actions should you perform in sequence? To answer, move the appropriate actions from the list of actions to the answer area and arrange them in the correct order.
Select and Place:
Answer:

Step 1: Create a Log Analytics workspace.
First create the workspace.
Step 2: Add a VMInsights solution.
Before a Log Analytics workspace can be used with VM insights, it must have the VMInsights solution installed.
Step 3: Install agents on the VM and VM scale set to be monitored.
Prior to onboarding agents, you must create and configure a workspace. Install or update the Application Insights Agent as an extension for Azure virtual machines and VM scalet sets.
Step 4: Create an Application Insights resource
Sign in to the Azure portal, and create an Application Insights resource.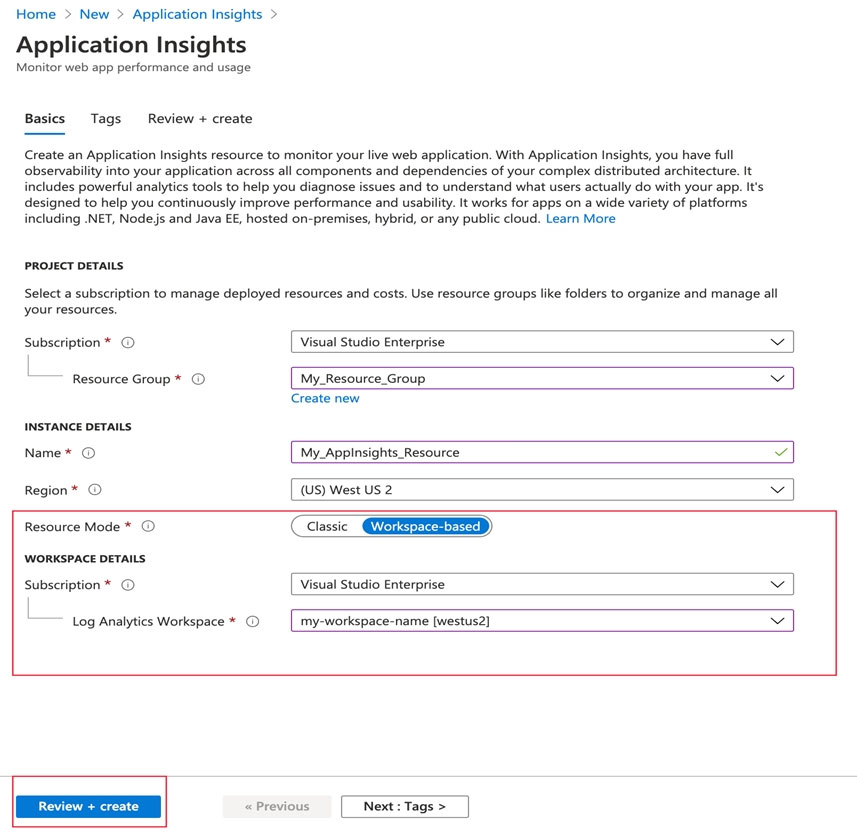
Once a workspace-based Application Insights resource has been created, configuring monitoring is relatively straightforward.
Reference:
https://docs.microsoft.com/en-us/azure/azure-monitor/vm/vminsights-configure-workspace https://docs.microsoft.com/en-us/azure/azure-monitor/app/create-workspace-resource
You develop and deploy an Azure App Service web app. The app is deployed to multiple regions and uses Azure Traffic Manager. Application Insights is enabled for the app.
You need to analyze app uptime for each month.
Which two solutions will achieve the goal? Each correct answer presents a complete solution.
NOTE: Each correct selection is worth one point.
Answer:
BD
Reference:
https://azure.microsoft.com/en-us/blog/creating-a-web-test-alert-programmatically-with-application-insights/