DRAG DROP -
You develop and deploy an Azure App Service web app. The web app accesses data in an Azure SQL database.
You must update the web app to store frequently used data in a new Azure Cache for Redis Premium instance.
You need to implement the Azure Cache for Redis features.
Which feature should you implement? To answer, drag the appropriate feature to the correct requirements. Each feature may be used once, more than once, or not at all. You may need to drag the split bar between panes or scroll to view content.
NOTE: Each correct selection is worth one point.
Select and Place:
Answer:

Reference:
https://www.red-gate.com/simple-talk/development/dotnet-development/overview-of-azure-cache-for-redis/ https://docs.microsoft.com/en-us/azure/architecture/best-practices/caching
You are developing an ASP.NET Core Web API web service. The web service uses Azure Application Insights for all telemetry and dependency tracking. The web service reads and writes data to a database other than Microsoft SQL Server.
You need to ensure that dependency tracking works for calls to the third-party database.
Which two dependency telemetry properties should you use? Each correct answer presents part of the solution.
NOTE: Each correct selection is worth one point.
Answer:
BD
Example:
public async Task Enqueue(string payload)
{
// StartOperation is a helper method that initializes the telemetry item
// and allows correlation of this operation with its parent and children. var operation = telemetryClient.StartOperation<DependencyTelemetry>("enqueue " + queueName);
operation.Telemetry.Type = "Azure Service Bus";
operation.Telemetry.Data = "Enqueue " + queueName;
var message = new BrokeredMessage(payload);
// Service Bus queue allows the property bag to pass along with the message.
// We will use them to pass our correlation identifiers (and other context)
// to the consumer.
message.Properties.Add("ParentId", operation.Telemetry.Id);
message.Properties.Add("RootId", operation.Telemetry.Context.Operation.Id);
Reference:
https://docs.microsoft.com/en-us/azure/azure-monitor/app/custom-operations-tracking
HOTSPOT -
You are using Azure Front Door Service.
You are expecting inbound files to be compressed by using Brotli compression. You discover that inbound XML files are not compressed. The files are 9 megabytes (MB) in size.
You need to determine the root cause for the issue.
To answer, select the appropriate options in the answer area.
NOTE: Each correct selection is worth one point.
Hot Area: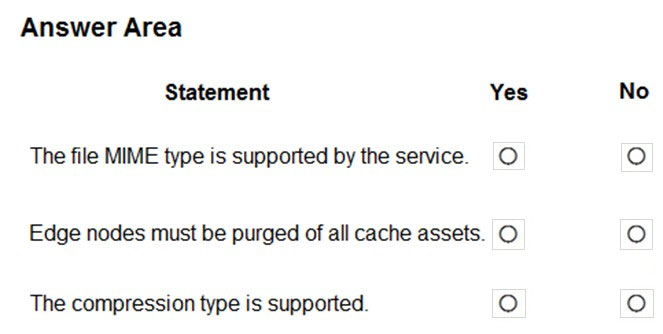
Answer:
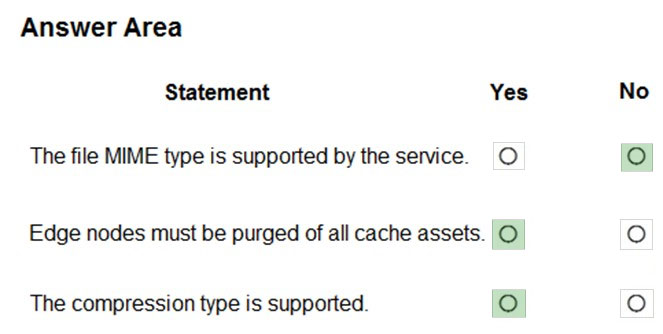
Box 1: No -
Front Door can dynamically compress content on the edge, resulting in a smaller and faster response to your clients. All files are eligible for compression.
However, a file must be of a MIME type that is eligible for compression list.
Box 2: No -
Sometimes you may wish to purge cached content from all edge nodes and force them all to retrieve new updated assets. This might be due to updates to your web application, or to quickly update assets that contain incorrect information.
Box 3: Yes -
These profiles support the following compression encodings: Gzip (GNU zip), Brotli
Reference:
https://docs.microsoft.com/en-us/azure/frontdoor/front-door-caching
HOTSPOT -
You are developing an Azure App Service hosted ASP.NET Core web app to deliver video-on-demand streaming media. You enable an Azure Content Delivery
Network (CDN) Standard for the web endpoint. Customer videos are downloaded from the web app by using the following example URL: http://www.contoso.com/ content.mp4?quality=1.
All media content must expire from the cache after one hour. Customer videos with varying quality must be delivered to the closest regional point of presence
(POP) node.
You need to configure Azure CDN caching rules.
Which options should you use? To answer, select the appropriate options in the answer area.
NOTE: Each correct selection is worth one point.
Hot Area: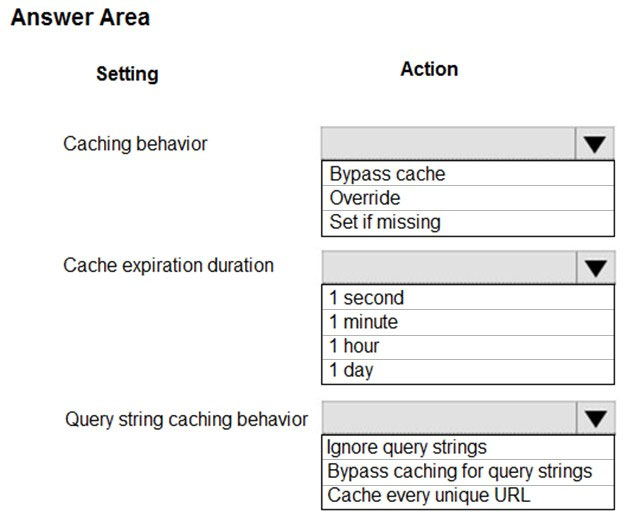
Answer:
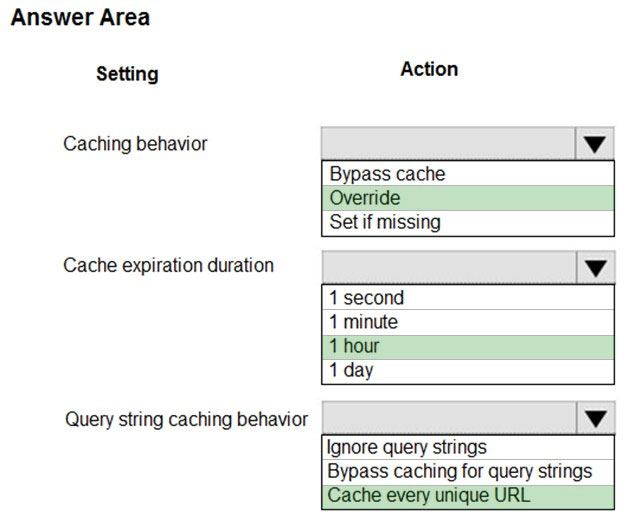
Box 1: Override -
Override: Ignore origin-provided cache duration; use the provided cache duration instead. This will not override cache-control: no-cache.
Set if missing: Honor origin-provided cache-directive headers, if they exist; otherwise, use the provided cache duration.
Incorrect:
Bypass cache: Do not cache and ignore origin-provided cache-directive headers.
Box 2: 1 hour -
All media content must expire from the cache after one hour.
Box 3: Cache every unique URL -
Cache every unique URL: In this mode, each request with a unique URL, including the query string, is treated as a unique asset with its own cache. For example, the response from the origin server for a request for example.ashx?q=test1 is cached at the POP node and returned for subsequent caches with the same query string. A request for example.ashx?q=test2 is cached as a separate asset with its own time-to-live setting.
Incorrect Answers:
Bypass caching for query strings: In this mode, requests with query strings are not cached at the CDN POP node. The POP node retrieves the asset directly from the origin server and passes it to the requestor with each request.
Ignore query strings: Default mode. In this mode, the CDN point-of-presence (POP) node passes the query strings from the requestor to the origin server on the first request and caches the asset. All subsequent requests for the asset that are served from the POP ignore the query strings until the cached asset expires.
Reference:
https://docs.microsoft.com/en-us/azure/cdn/cdn-query-string
HOTSPOT -
You are developing an ASP.NET Core time sheet application that runs as an Azure Web App. Users of the application enter their time sheet information on the first day of every month.
The application uses a third-party web service to validate data.
The application encounters periodic server errors due to errors that result from calling a third-party web server. Each request to the third-party server has the same chance of failure.
You need to configure an Azure Monitor alert to detect server errors unrelated to the third-party service. You must minimize false-positive alerts.
How should you complete the Azure Resource Manager template? To answer, select the appropriate options in the answer area.
NOTE: Each correct selection is worth one point.
Hot Area: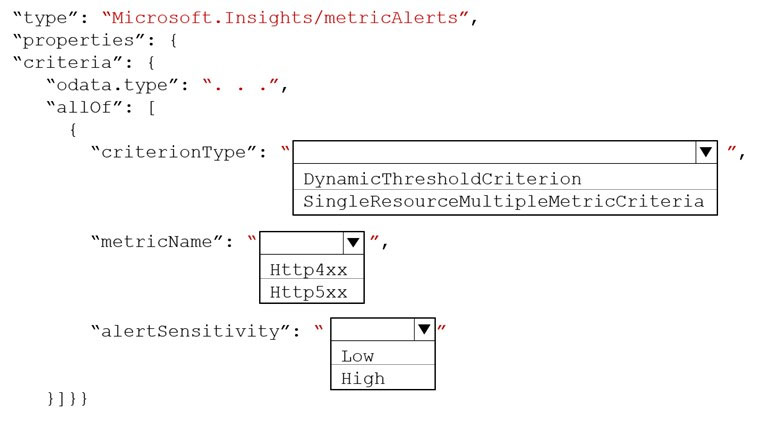
Answer:
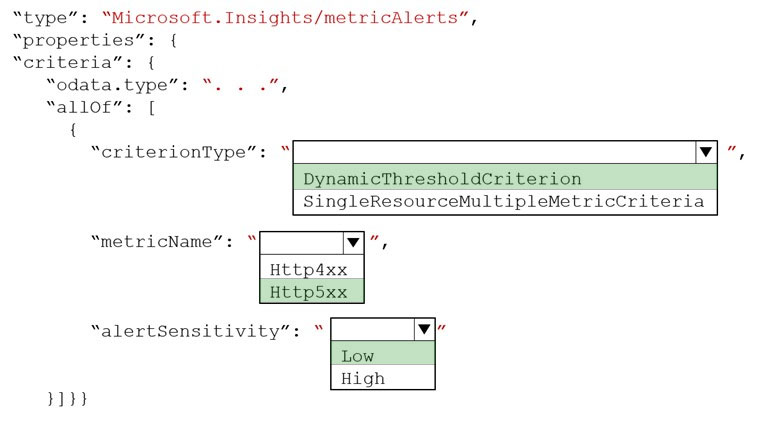
Box 1: DynamicThresholdCriterion
Box 2: Http5xx -
Server errors are in the 5xx range.
Client errors are in the 4xx range
Box 3: Low -
Reference:
https://docs.microsoft.com/en-us/azure/azure-monitor/alerts/alerts-dynamic-thresholds
You are developing a web application that uses Azure Cache for Redis. You anticipate that the cache will frequently fill and that you will need to evict keys.
You must configure Azure Cache for Redis based on the following predicted usage pattern: A small subset of elements will be accessed much more often than the rest.
You need to configure the Azure Cache for Redis to optimize performance for the predicted usage pattern.
Which two eviction policies will achieve the goal?
NOTE: Each correct selection is worth one point.
Answer:
BC
B: The allkeys-lru policy evict keys by trying to remove the less recently used (LRU) keys first, in order to make space for the new data added. Use the allkeys-lru policy when you expect a power-law distribution in the popularity of your requests, that is, you expect that a subset of elements will be accessed far more often than the rest.
C: volatile-lru: evict keys by trying to remove the less recently used (LRU) keys first, but only among keys that have an expire set, in order to make space for the new data added.
Note: The allkeys-lru policy is more memory efficient since there is no need to set an expire for the key to be evicted under memory pressure.
Reference:
https://redis.io/topics/lru-cache
DRAG DROP -
An organization has web apps hosted in Azure.
The organization wants to track events and telemetry data in the web apps by using Application Insights.
You need to configure the web apps for Application Insights.
Which three actions should you perform in sequence? To answer, move the appropriate actions from the list of actions to the answer area and arrange them in the correct order.
Select and Place: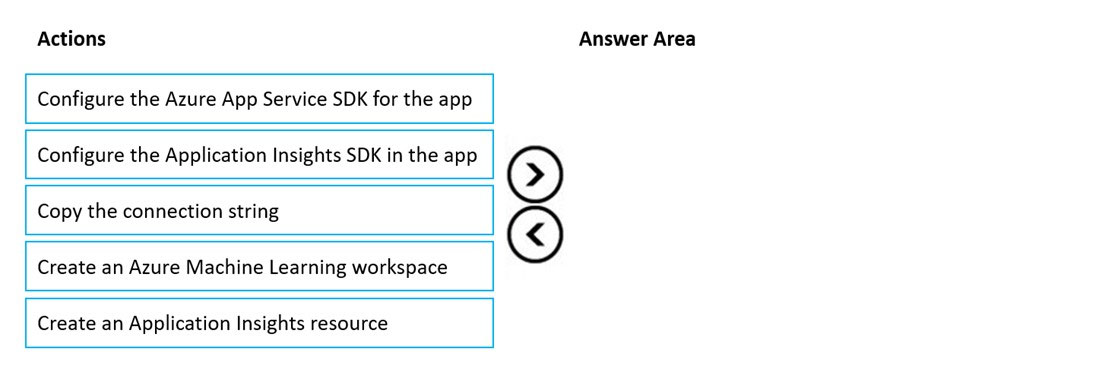
Answer:
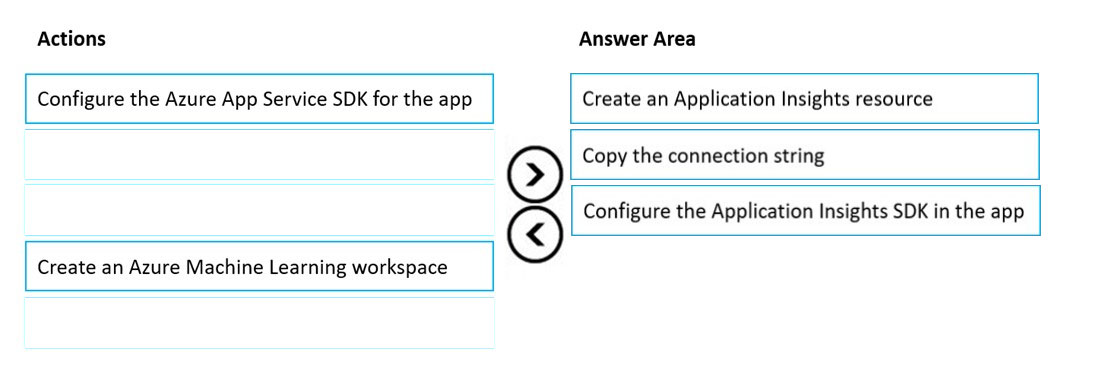
Step 1: Create an Application Insights resource
Creating an Application Insights workspace-based resource us a prerequisite.
Step 2: Copy the connection string
A connection string identifies the resource that you want to associate with your telemetry data. It also allows you to modify the endpoints that your resource will use as a destination for your telemetry. You'll need to copy the connection string and add it to your application's code or to an environment variable.
Step 3: Configure the Application Insights SDK in the app
The Application Insights SDK for ASP.NET Core can monitor your applications no matter where or how they run.
Install the Application Insights SDK NuGet package for ASP.NET Core.
Reference:
https://docs.microsoft.com/en-us/azure/azure-monitor/app/asp-net-core
An organization hosts web apps in Azure. The organization uses Azure Monitor.
You discover that configuration changes were made to some of the web apps.
You need to identify the configuration changes.
Which Azure Monitor log should you review?
Answer:
B
The log type AppServiceEnvironmentPlatformLogs handles the App Service Environment: scaling, configuration changes, and status logs.
Incorrect:
AppServiceAppLogs contains logs generated through your application.
AppServiceAuditLogs logs generated when publishing users successfully log on via one of the App Service publishing protocols.
Reference:
https://docs.microsoft.com/en-us/azure/app-service/troubleshoot-diagnostic-logs
You develop and deploy an Azure App Service web app to a production environment. You enable the Always On setting and the Application Insights site extensions.
You deploy a code update and receive multiple failed requests and exceptions in the web app.
You need to validate the performance and failure counts of the web app in near real time.
Which Application Insights tool should you use?
Answer:
C
Live Metrics Stream -
Deploying the latest build can be an anxious experience. If there are any problems, you want to know about them right away, so that you can back out if necessary. Live Metrics Stream gives you key metrics with a latency of about one second.
With Live Metrics Stream, you can:
* Validate a fix while it's released, by watching performance and failure counts.
* Etc.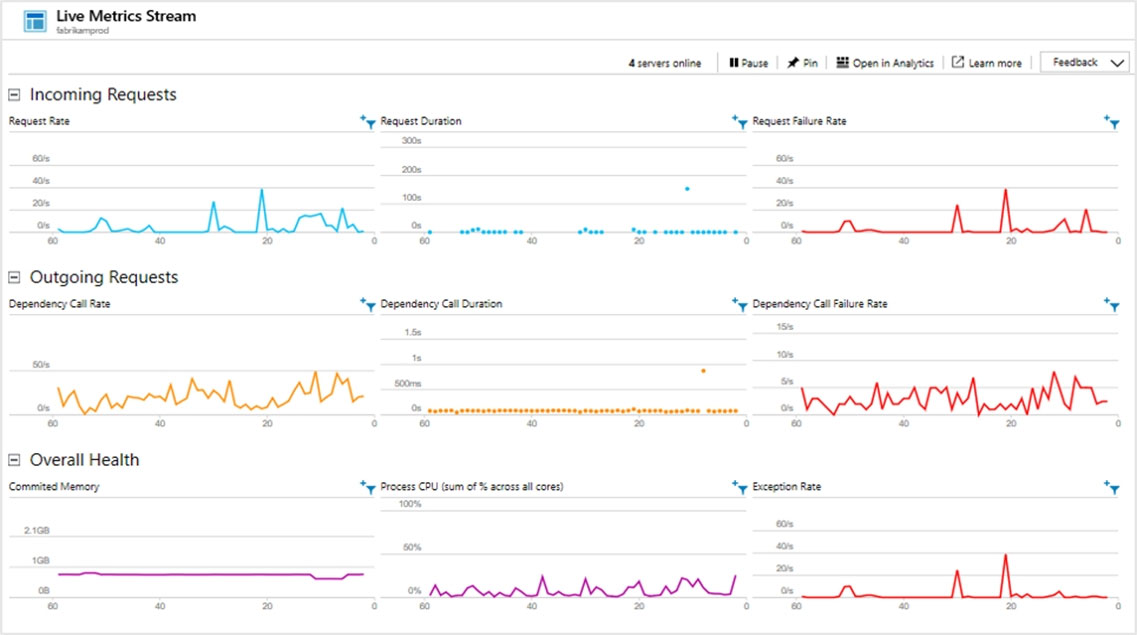
Incorrect:
* Profiler
Azure Application Insights Profiler provides performance traces for applications running in production in Azure. Profiler:
Captures the data automatically at scale without negatively affecting your users.
Helps you identify the ג€hotג€ code path spending the most time handling a particular web request.
* Snapshot debugger
When an exception occurs, you can automatically collect a debug snapshot from your live web application. The snapshot shows the state of source code and variables at the moment the exception was thrown. The Snapshot Debugger in Azure Application Insights monitors exception telemetry from your web app. It collects snapshots on your top-throwing exceptions so that you have the information you need to diagnose issues in production.
Reference:
https://docs.microsoft.com/en-us/azure/azure-monitor/app/live-stream
HOTSPOT -
You deploy an ASP.NET web app to Azure App Service.
You must monitor the web app by using Application Insights.
You need to configure Application Insights to meet the requirements.
Which feature should you use? To answer, select the appropriate options in the answer area.
NOTE: Each correct selection is worth one point.
Hot Area: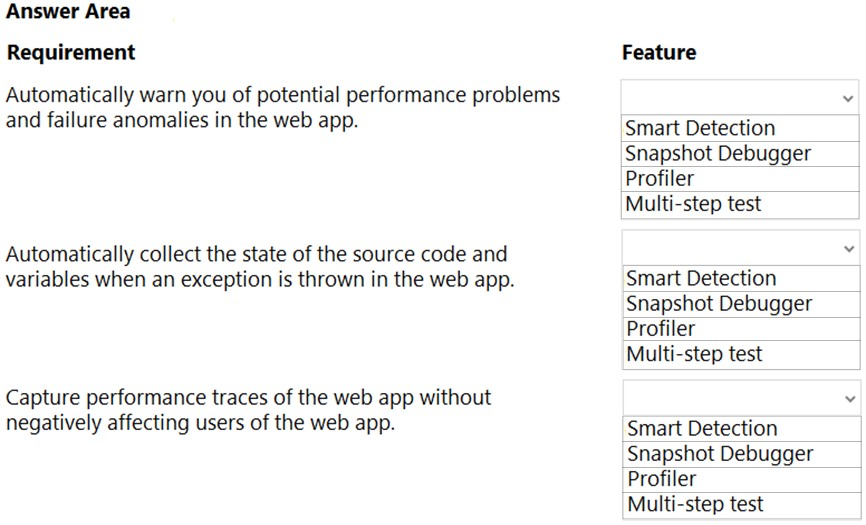
Answer:
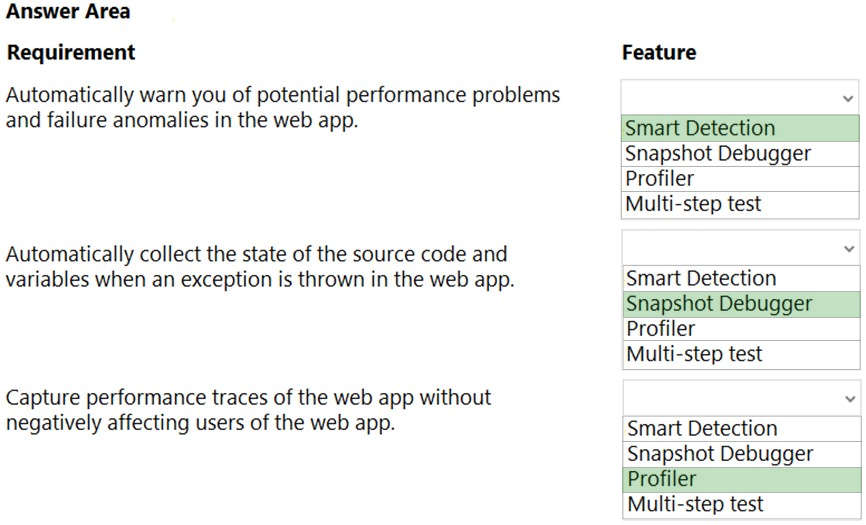
Box 1: Smart Detection -
Smart detection automatically warns you of potential performance problems and failure anomalies in your web application. It performs proactive analysis of the telemetry that your app sends to Application Insights. If there is a sudden rise in failure rates, or abnormal patterns in client or server performance, you get an alert. This feature needs no configuration. It operates if your application sends enough telemetry.
Box 2: Snapshot Debugger -
When an exception occurs, you can automatically collect a debug snapshot from your live web application. The snapshot shows the state of source code and variables at the moment the exception was thrown. The Snapshot Debugger in Azure Application Insights monitors exception telemetry from your web app. It collects snapshots on your top-throwing exceptions so that you have the information you need to diagnose issues in production.
Box 3: Profiler -
Azure Application Insights Profiler provides performance traces for applications running in production in Azure. Profiler:
Captures the data automatically at scale without negatively affecting your users.
Helps you identify the ג€hotג€ code path spending the most time handling a particular web request.
Reference:
https://docs.microsoft.com/en-us/azure/azure-monitor/app/proactive-diagnostics https://docs.microsoft.com/en-us/azure/azure-monitor/snapshot-debugger/snapshot-debugger https://docs.microsoft.com/en-us/azure/azure-monitor/profiler/profiler-overview