You have a Microsoft Power BI report. The size of PBIX file is 550 MB. The report is accessed by using an App workspace in shared capacity of powerbi.com.
The report uses an imported dataset that contains one fact table. The fact table contains 12 million rows. The dataset is scheduled to refresh twice a day at 08:00 and 17:00.
The report is a single page that contains 15 AppSource visuals and 10 default visuals.
Users say that the report is slow to load the visuals when they access and interact with the report.
You need to recommend a solution to improve the performance of the report.
What should you recommend?
Answer:
B
You have a CSV file that contains user complaints. The file contains a column named Logged. Logged contains the date and time each complaint occurred. The data in Logged is in the following format: 2018-12-31 at 08:59.
You need to be able to analyze the complaints by the logged date and use a built-in date hierarchy.
What should you do?
Answer:
C
HOTSPOT
-
You have the Power BI data model shown in the following exhibit.
You need to create a measure to count the number of product categories that had products sold during a selected period.
How should you complete the DAX expression? To answer, select the appropriate options in the answer area.
NOTE: Each correct selection is worth one point.
Answer:

DRAG DROP -
You have a Microsoft Excel spreadsheet that contains the data shown in the following table.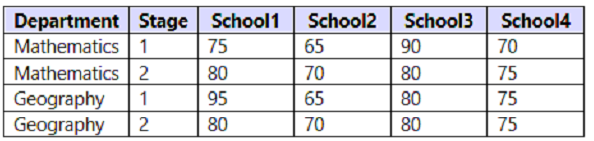
You plan to build a data model for a Power BI report.
You need to prepare the data so that it is available to the model in the format shown in the following table.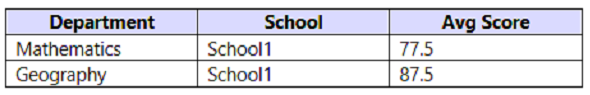
Which three actions should you perform in sequence in Power Query Editor? To answer, move the appropriate actions from the list of actions to the answer area and arrange them in the correct order.
Select and Place: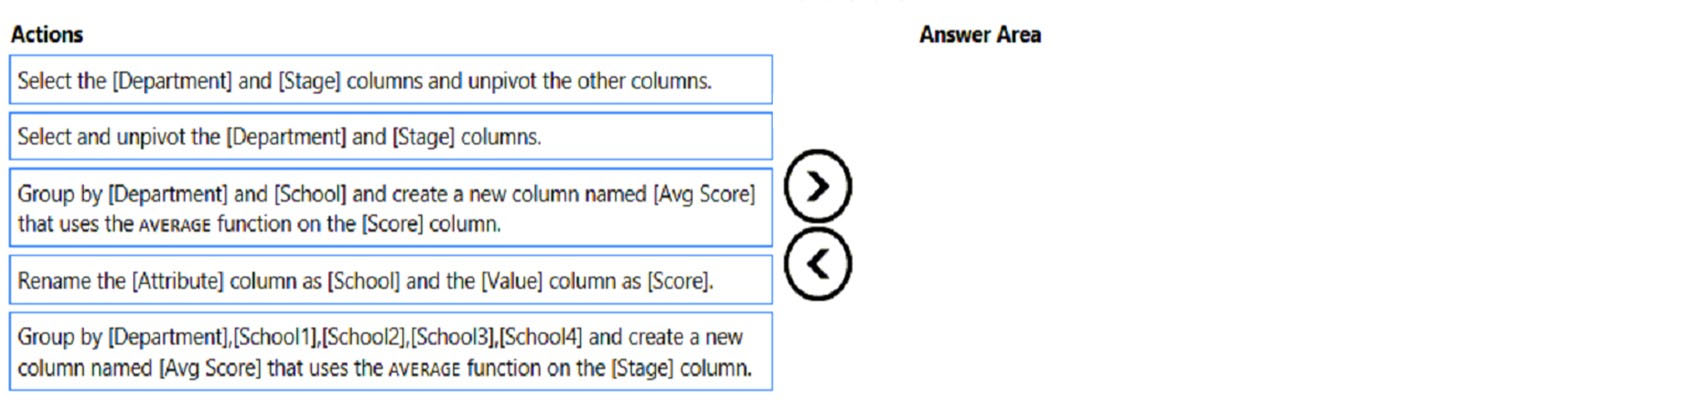
Answer:
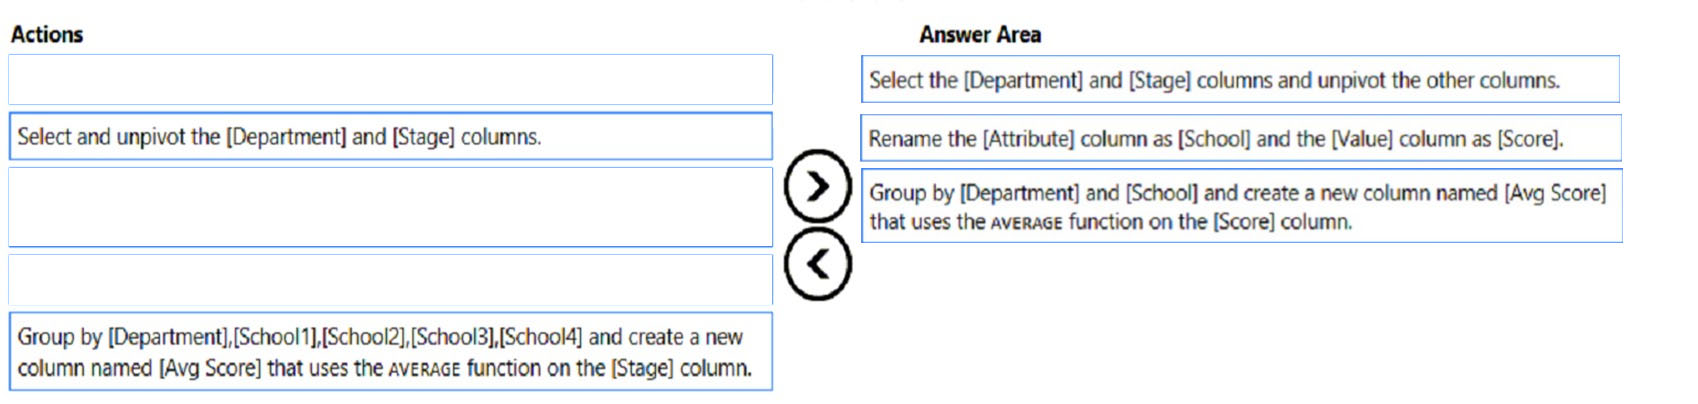
Step 1: Select the [Department] and [Stage] columns and unpivot the other columns.
We unpivot the School1, School2, School3, and the School4 columns.
You might want to unpivot data, sometimes called flattening the data, to put it in a matrix format so that all similar values are in one column.
Example: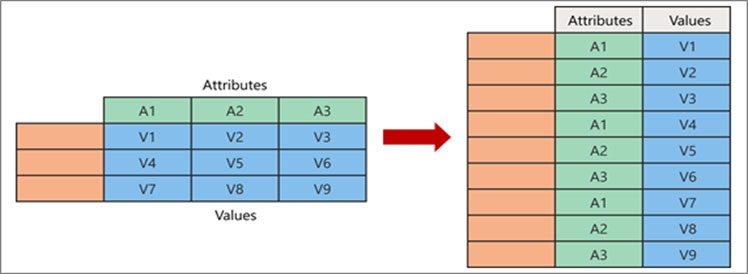
When you unpivot, you unpack the attribute-value pairs that represent an intersection point of the new columns and re-orient them into flattened columns:
* Values (in blue on the left) are unpivoted into a new column (in blue on the right).
* Attributes (in green on the left) are unpivoted into a new column (in green on the right) and duplicates are correspondingly mapped to the new Values column.
Step 2: Rename the [Attribute] column as [School] and the [Value] column as [Score[,
Step 3: Group by [Department] and [School] and..
Reference:
https://support.microsoft.com/en-us/office/unpivot-columns-power-query-0f7bad4b-9ea1-49c1-9d95-f588221c7098
You have a report that contains a bar chart and a column chart. The bar chart shows customer count by customer segment. The column chart shows sales by month.
You need to ensure that when a segment is selected in the bar chart, you see which portion of the total sales for the month belongs to the customer segment.
How should the visual interactions be set on the column chart when the bar chart is selected?
Answer:
A
In most visuals, highlighting doesn't remove the unrelated data. Instead it highlights the related data. The rest of the data remains visible but dimmed.
Note: By default, visualizations on a report page can be used to cross-filter and cross-highlight the other visualizations on the page. For example, selecting a state on a map visualization highlights the column chart and filters the line chart to display only data that applies to that one state.
Incorrect:
Not B: Filters remove all but the data you want to focus on.
Reference:
https://docs.microsoft.com/en-us/power-bi/create-reports/power-bi-reports-filters-and-highlighting
A user creates a Power BI report named ReportA that uses a custom theme.
You create a dashboard named DashboardA.
You need to ensure that DashboardA uses the custom theme. The solution must minimize development effort.
Which two actions should you perform? Each correct answer presents part of the solution.
NOTE: Each correct selection is worth one point.
Answer:
AE
A: With Power BI Desktop report themes, you can apply design changes to your entire report, such as using corporate colors, changing icon sets, or applying new default visual formatting.
When you publish a Power BI Desktop file to the Power BI service, you publish the data in the model to your Power BI workspace. The same is true for any reports you created in Report view.
To publish a Power BI Desktop dataset and reports
1. In Power BI Desktop, choose File > Publish > Publish to Power BI or select Publish on the ribbon.
Sign in to Power BI, if you aren't already signed in.
2. Select the destination. You can search your list of available workspaces to find the workspace into which you want to publish. The search box lets you filter your workspaces. Select the workspace, and then click the Select button to publish.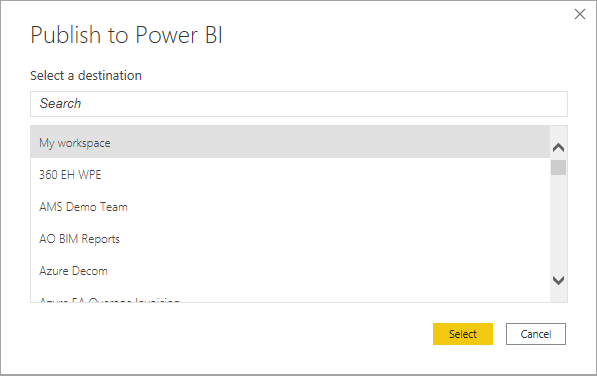
3. Etc.
E: One way to create a custom theme is to upload a JSON file that has settings for all the colors you'd like to use for your dashboard. In Power BI Desktop, report creators use JSON files to create themes for reports. You can upload these same JSON files for dashboards, or find and upload JSON files from the Theme gallery page in the Power BI Community.
You can also save your custom theme as a JSON file and then share it with other dashboard creators.
Reference:
https://docs.microsoft.com/en-us/power-bi/create-reports/desktop-upload-desktop-files https://docs.microsoft.com/en-us/power-bi/create-reports/service-dashboard-themes
You need to create a visualization that compares revenue and cost over time.
Which type of visualization should you use?
Answer:
C
Line charts can have many different lines, for example both revenue and cost over time.
Reference:
https://docs.microsoft.com/en-us/power-bi/visuals/power-bi-line-chart
HOTSPOT -
You have a report in Power BI Desktop.
You add a key influencers visual as shown in the exhibit. (Click the Exhibit tab.)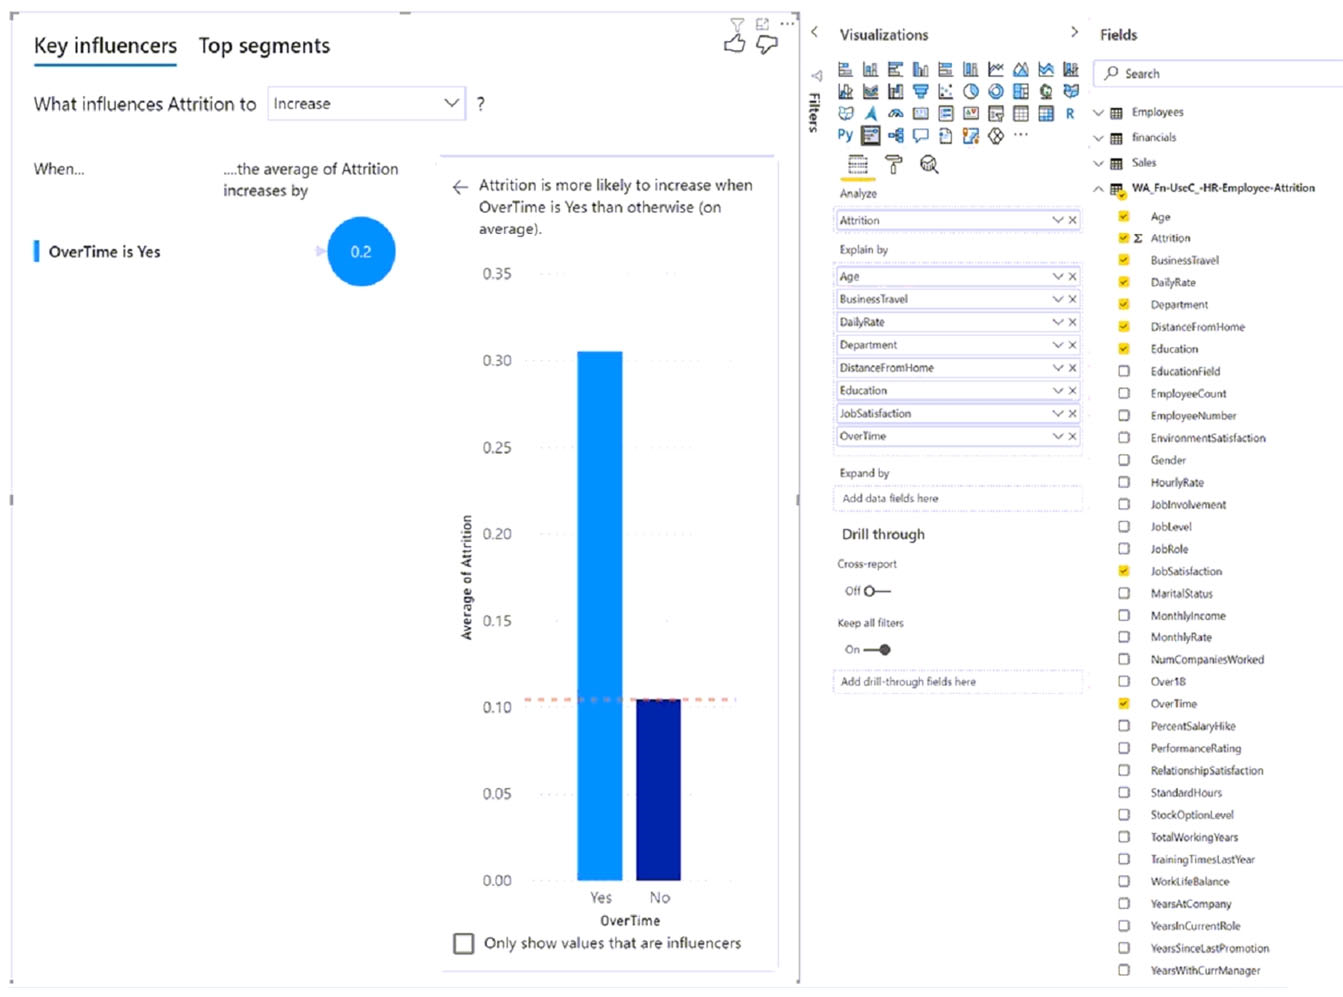
Use the drop-down menus to select the answer choice that completes each statement based on the information presented in the graphic.
NOTE: Each correct selection is worth one point.
Hot Area: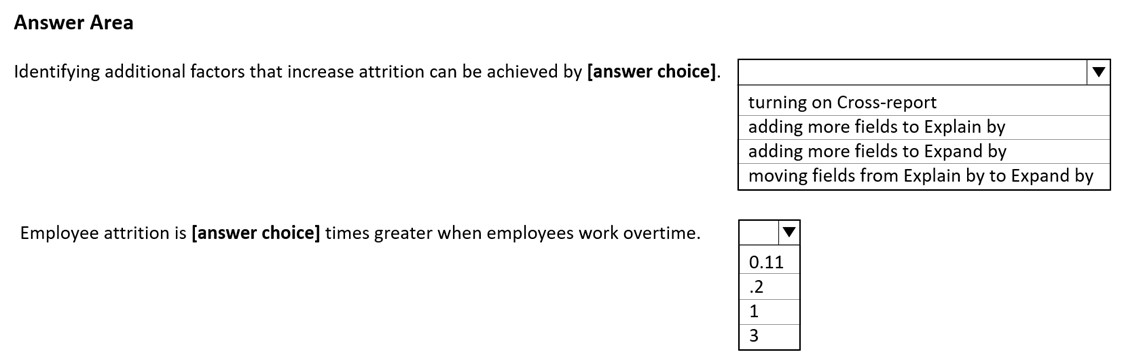
Answer:
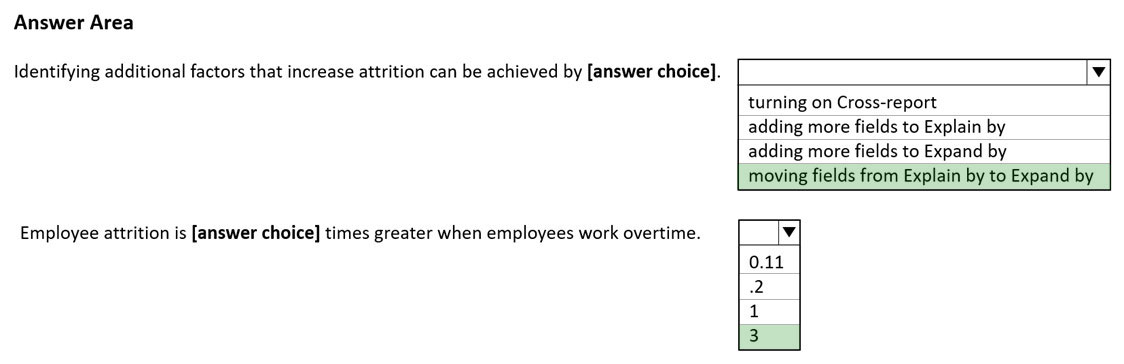
Box 1: moving fields from Explain by to Expand by
You can use Expand By to add fields you want to use for setting the level of the analysis without looking for new influencers.
Why do certain factors become influencers or stop being influencers as I move more fields into the Explain by field?
The visualization evaluates all explanatory factors together. A factor might be an influencer by itself, but when it's considered with other factors it might not.
Box 2: 3 -
0.30 instead of 0.10. A factor of 3 greater.
Reference:
https://docs.microsoft.com/en-us/power-bi/visuals/power-bi-visualization-influencers
You build a report to help the sales team understand its performance and the drivers of sales.
The team needs to have a single visualization to identify which factors affect success.
Which type of visualization should you use?
Answer:
A
The key influencers visual helps you understand the factors that drive a metric you're interested in. It analyzes your data, ranks the factors that matter, and displays them as key influencers. For example, suppose you want to figure out what influences employee turnover, which is also known as churn. One factor might be employment contract length, and another factor might be commute time.
When to use key influencers.
The key influencers visual is a great choice if you want to:
See which factors affect the metric being analyzed.
Contrast the relative importance of these factors. For example, do short-term contracts affect churn more than long-term contracts?
Reference:
https://docs.microsoft.com/en-us/power-bi/visuals/power-bi-visualization-influencers
HOTSPOT -
You have a table that contains the following three columns:
City -
✑ Total Sales
✑ Occupation
You need to create a key influencers visualization as shown in the exhibit. (Click the Exhibit tab.)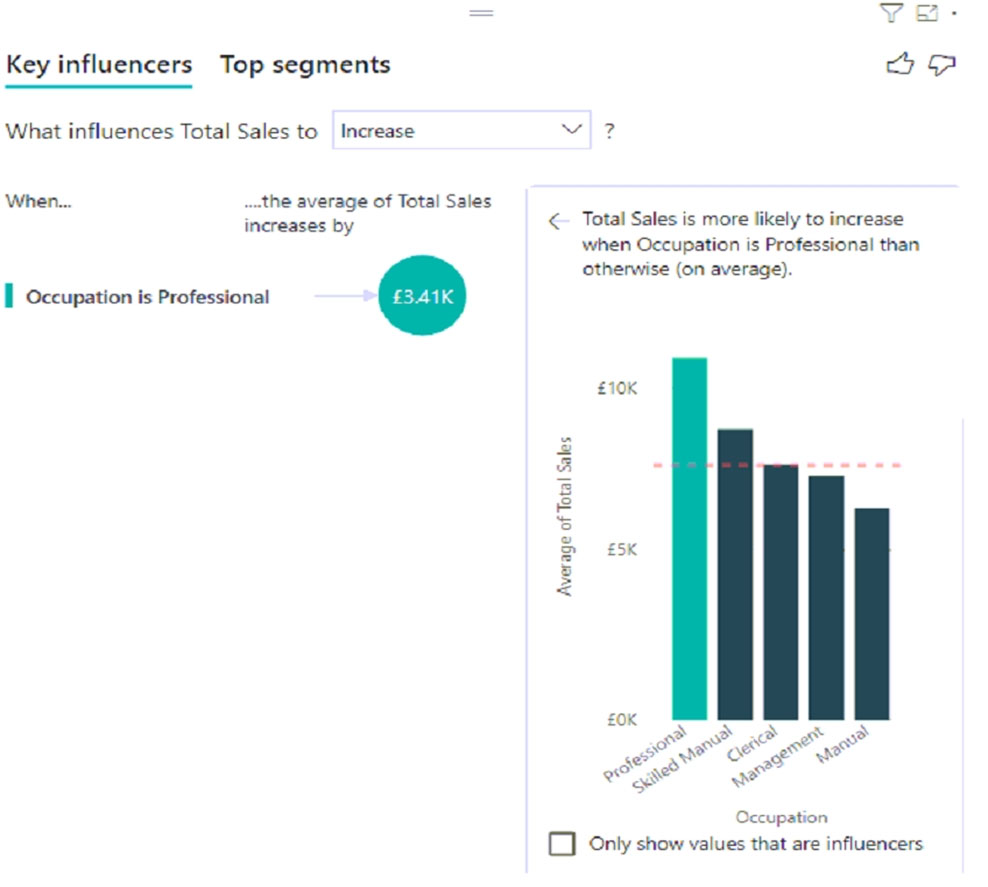
How should you configure the visualization? To answer, select the appropriate options in the answer area.
NOTE: Each correct selection is worth one point.
Hot Area: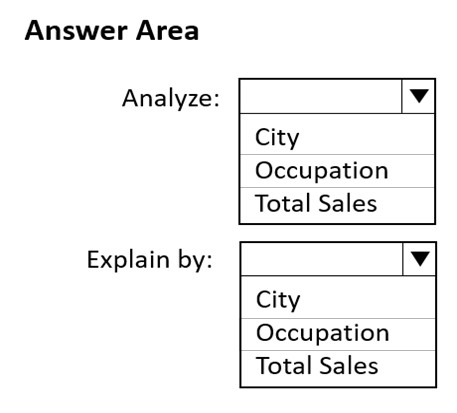
Answer:
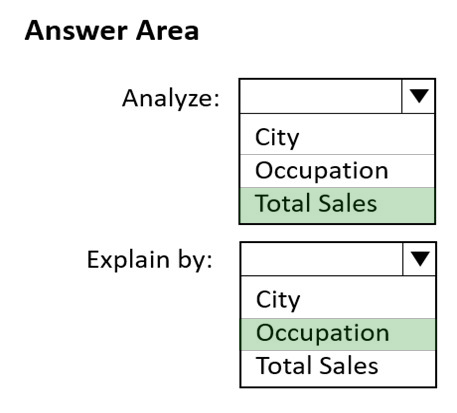
Box 1: Total Sales -
The key influencers visual helps you understand the factors that drive a metric you're interested in, here Total Sales. It analyzes your data, ranks the factors that matter, and displays them as key influencers.
Box 2: Occupation -
Measures and summarized columns are automatically analyzed at the level of the Explain by fields used.
Reference:
https://docs.microsoft.com/en-us/power-bi/visuals/power-bi-visualization-influencers