MJTelco Case Study -
Company Overview -
MJTelco is a startup that plans to build networks in rapidly growing, underserved markets around the world. The company has patents for innovative optical communications hardware. Based on these patents, they can create many reliable, high-speed backbone links with inexpensive hardware.
Company Background -
Founded by experienced telecom executives, MJTelco uses technologies originally developed to overcome communications challenges in space. Fundamental to their operation, they need to create a distributed data infrastructure that drives real-time analysis and incorporates machine learning to continuously optimize their topologies. Because their hardware is inexpensive, they plan to overdeploy the network allowing them to account for the impact of dynamic regional politics on location availability and cost.
Their management and operations teams are situated all around the globe creating many-to-many relationship between data consumers and provides in their system. After careful consideration, they decided public cloud is the perfect environment to support their needs.
Solution Concept -
MJTelco is running a successful proof-of-concept (PoC) project in its labs. They have two primary needs:
✑ Scale and harden their PoC to support significantly more data flows generated when they ramp to more than 50,000 installations.
Refine their machine-learning cycles to verify and improve the dynamic models they use to control topology definition.
MJTelco will also use three separate operating environments `" development/test, staging, and production `" to meet the needs of running experiments, deploying new features, and serving production customers.
Business Requirements -
✑ Scale up their production environment with minimal cost, instantiating resources when and where needed in an unpredictable, distributed telecom user community.
✑ Ensure security of their proprietary data to protect their leading-edge machine learning and analysis.
✑ Provide reliable and timely access to data for analysis from distributed research workers
✑ Maintain isolated environments that support rapid iteration of their machine-learning models without affecting their customers.
Technical Requirements -
Ensure secure and efficient transport and storage of telemetry data
Rapidly scale instances to support between 10,000 and 100,000 data providers with multiple flows each.
Allow analysis and presentation against data tables tracking up to 2 years of data storing approximately 100m records/day
Support rapid iteration of monitoring infrastructure focused on awareness of data pipeline problems both in telemetry flows and in production learning cycles.
CEO Statement -
Our business model relies on our patents, analytics and dynamic machine learning. Our inexpensive hardware is organized to be highly reliable, which gives us cost advantages. We need to quickly stabilize our large distributed data pipelines to meet our reliability and capacity commitments.
CTO Statement -
Our public cloud services must operate as advertised. We need resources that scale and keep our data secure. We also need environments in which our data scientists can carefully study and quickly adapt our models. Because we rely on automation to process our data, we also need our development and test environments to work as we iterate.
CFO Statement -
The project is too large for us to maintain the hardware and software required for the data and analysis. Also, we cannot afford to staff an operations team to monitor so many data feeds, so we will rely on automation and infrastructure. Google Cloud's machine learning will allow our quantitative researchers to work on our high-value problems instead of problems with our data pipelines.
You need to compose visualization for operations teams with the following requirements:
✑ Telemetry must include data from all 50,000 installations for the most recent 6 weeks (sampling once every minute)
✑ The report must not be more than 3 hours delayed from live data.
✑ The actionable report should only show suboptimal links.
✑ Most suboptimal links should be sorted to the top.
Suboptimal links can be grouped and filtered by regional geography.
✑ User response time to load the report must be <5 seconds.
You create a data source to store the last 6 weeks of data, and create visualizations that allow viewers to see multiple date ranges, distinct geographic regions, and unique installation types. You always show the latest data without any changes to your visualizations. You want to avoid creating and updating new visualizations each month. What should you do?
B
MJTelco Case Study -
Company Overview -
MJTelco is a startup that plans to build networks in rapidly growing, underserved markets around the world. The company has patents for innovative optical communications hardware. Based on these patents, they can create many reliable, high-speed backbone links with inexpensive hardware.
Company Background -
Founded by experienced telecom executives, MJTelco uses technologies originally developed to overcome communications challenges in space. Fundamental to their operation, they need to create a distributed data infrastructure that drives real-time analysis and incorporates machine learning to continuously optimize their topologies. Because their hardware is inexpensive, they plan to overdeploy the network allowing them to account for the impact of dynamic regional politics on location availability and cost.
Their management and operations teams are situated all around the globe creating many-to-many relationship between data consumers and provides in their system. After careful consideration, they decided public cloud is the perfect environment to support their needs.
Solution Concept -
MJTelco is running a successful proof-of-concept (PoC) project in its labs. They have two primary needs:
✑ Scale and harden their PoC to support significantly more data flows generated when they ramp to more than 50,000 installations.
✑ Refine their machine-learning cycles to verify and improve the dynamic models they use to control topology definition.
MJTelco will also use three separate operating environments `" development/test, staging, and production `" to meet the needs of running experiments, deploying new features, and serving production customers.
Business Requirements -
✑ Scale up their production environment with minimal cost, instantiating resources when and where needed in an unpredictable, distributed telecom user community.
✑ Ensure security of their proprietary data to protect their leading-edge machine learning and analysis.
✑ Provide reliable and timely access to data for analysis from distributed research workers
✑ Maintain isolated environments that support rapid iteration of their machine-learning models without affecting their customers.
Technical Requirements -
Ensure secure and efficient transport and storage of telemetry data
Rapidly scale instances to support between 10,000 and 100,000 data providers with multiple flows each.
Allow analysis and presentation against data tables tracking up to 2 years of data storing approximately 100m records/day
Support rapid iteration of monitoring infrastructure focused on awareness of data pipeline problems both in telemetry flows and in production learning cycles.
CEO Statement -
Our business model relies on our patents, analytics and dynamic machine learning. Our inexpensive hardware is organized to be highly reliable, which gives us cost advantages. We need to quickly stabilize our large distributed data pipelines to meet our reliability and capacity commitments.
CTO Statement -
Our public cloud services must operate as advertised. We need resources that scale and keep our data secure. We also need environments in which our data scientists can carefully study and quickly adapt our models. Because we rely on automation to process our data, we also need our development and test environments to work as we iterate.
CFO Statement -
The project is too large for us to maintain the hardware and software required for the data and analysis. Also, we cannot afford to staff an operations team to monitor so many data feeds, so we will rely on automation and infrastructure. Google Cloud's machine learning will allow our quantitative researchers to work on our high-value problems instead of problems with our data pipelines.
Given the record streams MJTelco is interested in ingesting per day, they are concerned about the cost of Google BigQuery increasing. MJTelco asks you to provide a design solution. They require a single large data table called tracking_table. Additionally, they want to minimize the cost of daily queries while performing fine-grained analysis of each day's events. They also want to use streaming ingestion. What should you do?
B
Flowlogistic Case Study -
Company Overview -
Flowlogistic is a leading logistics and supply chain provider. They help businesses throughout the world manage their resources and transport them to their final destination. The company has grown rapidly, expanding their offerings to include rail, truck, aircraft, and oceanic shipping.
Company Background -
The company started as a regional trucking company, and then expanded into other logistics market. Because they have not updated their infrastructure, managing and tracking orders and shipments has become a bottleneck. To improve operations, Flowlogistic developed proprietary technology for tracking shipments in real time at the parcel level. However, they are unable to deploy it because their technology stack, based on Apache Kafka, cannot support the processing volume. In addition, Flowlogistic wants to further analyze their orders and shipments to determine how best to deploy their resources.
Solution Concept -
Flowlogistic wants to implement two concepts using the cloud:
✑ Use their proprietary technology in a real-time inventory-tracking system that indicates the location of their loads
✑ Perform analytics on all their orders and shipment logs, which contain both structured and unstructured data, to determine how best to deploy resources, which markets to expand info. They also want to use predictive analytics to learn earlier when a shipment will be delayed.
Existing Technical Environment -
Flowlogistic architecture resides in a single data center:
✑ Databases
- 8 physical servers in 2 clusters
- SQL Server `" user data, inventory, static data
- 3 physical servers
- Cassandra `" metadata, tracking messages
10 Kafka servers `" tracking message aggregation and batch insert
✑ Application servers `" customer front end, middleware for order/customs
- 60 virtual machines across 20 physical servers
- Tomcat `" Java services
- Nginx `" static content
- Batch servers
✑ Storage appliances
- iSCSI for virtual machine (VM) hosts
- Fibre Channel storage area network (FC SAN) `" SQL server storage
Network-attached storage (NAS) image storage, logs, backups
✑ 10 Apache Hadoop /Spark servers
- Core Data Lake
- Data analysis workloads
✑ 20 miscellaneous servers
- Jenkins, monitoring, bastion hosts,
Business Requirements -
✑ Build a reliable and reproducible environment with scaled panty of production.
✑ Aggregate data in a centralized Data Lake for analysis
✑ Use historical data to perform predictive analytics on future shipments
✑ Accurately track every shipment worldwide using proprietary technology
✑ Improve business agility and speed of innovation through rapid provisioning of new resources
✑ Analyze and optimize architecture for performance in the cloud
✑ Migrate fully to the cloud if all other requirements are met
Technical Requirements -
✑ Handle both streaming and batch data
✑ Migrate existing Hadoop workloads
✑ Ensure architecture is scalable and elastic to meet the changing demands of the company.
✑ Use managed services whenever possible
✑ Encrypt data flight and at rest
Connect a VPN between the production data center and cloud environment
SEO Statement -
We have grown so quickly that our inability to upgrade our infrastructure is really hampering further growth and efficiency. We are efficient at moving shipments around the world, but we are inefficient at moving data around.
We need to organize our information so we can more easily understand where our customers are and what they are shipping.
CTO Statement -
IT has never been a priority for us, so as our data has grown, we have not invested enough in our technology. I have a good staff to manage IT, but they are so busy managing our infrastructure that I cannot get them to do the things that really matter, such as organizing our data, building the analytics, and figuring out how to implement the CFO' s tracking technology.
CFO Statement -
Part of our competitive advantage is that we penalize ourselves for late shipments and deliveries. Knowing where out shipments are at all times has a direct correlation to our bottom line and profitability. Additionally, I don't want to commit capital to building out a server environment.
Flowlogistic's management has determined that the current Apache Kafka servers cannot handle the data volume for their real-time inventory tracking system.
You need to build a new system on Google Cloud Platform (GCP) that will feed the proprietary tracking software. The system must be able to ingest data from a variety of global sources, process and query in real-time, and store the data reliably. Which combination of GCP products should you choose?
C
After migrating ETL jobs to run on BigQuery, you need to verify that the output of the migrated jobs is the same as the output of the original. You've loaded a table containing the output of the original job and want to compare the contents with output from the migrated job to show that they are identical. The tables do not contain a primary key column that would enable you to join them together for comparison.
What should you do?
B
You are a head of BI at a large enterprise company with multiple business units that each have different priorities and budgets. You use on-demand pricing for
BigQuery with a quota of 2K concurrent on-demand slots per project. Users at your organization sometimes don't get slots to execute their query and you need to correct this. You'd like to avoid introducing new projects to your account.
What should you do?
C
Reference:
https://cloud.google.com/blog/products/gcp/busting-12-myths-about-bigquery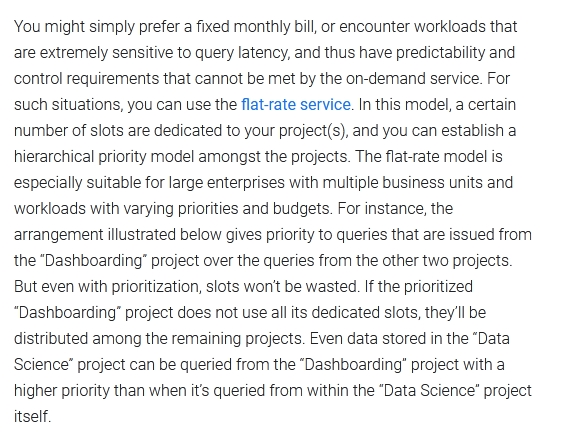
You have an Apache Kafka cluster on-prem with topics containing web application logs. You need to replicate the data to Google Cloud for analysis in BigQuery and Cloud Storage. The preferred replication method is mirroring to avoid deployment of Kafka Connect plugins.
What should you do?
A
You've migrated a Hadoop job from an on-prem cluster to dataproc and GCS. Your Spark job is a complicated analytical workload that consists of many shuffling operations and initial data are parquet files (on average 200-400 MB size each). You see some degradation in performance after the migration to Dataproc, so you'd like to optimize for it. You need to keep in mind that your organization is very cost-sensitive, so you'd like to continue using Dataproc on preemptibles (with 2 non-preemptible workers only) for this workload.
What should you do?
D
Your team is responsible for developing and maintaining ETLs in your company. One of your Dataflow jobs is failing because of some errors in the input data, and you need to improve reliability of the pipeline (incl. being able to reprocess all failing data).
What should you do?
C
You're training a model to predict housing prices based on an available dataset with real estate properties. Your plan is to train a fully connected neural net, and you've discovered that the dataset contains latitude and longitude of the property. Real estate professionals have told you that the location of the property is highly influential on price, so you'd like to engineer a feature that incorporates this physical dependency.
What should you do?
B
Reference:
https://cloud.google.com/bigquery/docs/gis-data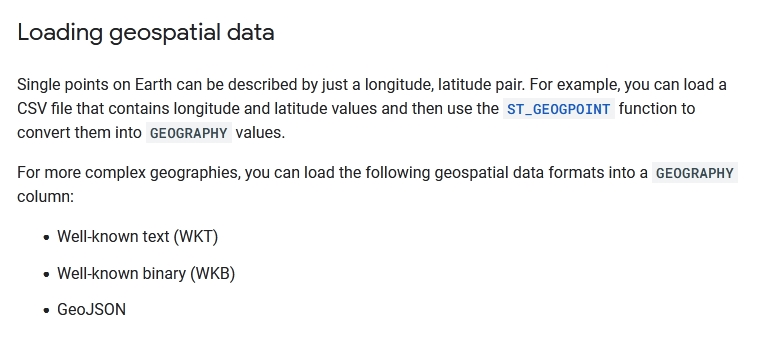
You are deploying MariaDB SQL databases on GCE VM Instances and need to configure monitoring and alerting. You want to collect metrics including network connections, disk IO and replication status from MariaDB with minimal development effort and use StackDriver for dashboards and alerts.
What should you do?
C