You have an Azure data solution that contains an enterprise data warehouse in Azure Synapse Analytics named DW1.
Several users execute adhoc queries to DW1 concurrently.
You regularly perform automated data loads to DW1.
You need to ensure that the automated data loads have enough memory available to complete quickly and successfully when the adhoc queries run.
What should you do?
Answer:
C
The performance capacity of a query is determined by the user's resource class.
Smaller resource classes reduce the maximum memory per query, but increase concurrency.
Larger resource classes increase the maximum memory per query, but reduce concurrency.
Reference:
https://docs.microsoft.com/en-us/azure/synapse-analytics/sql-data-warehouse/resource-classes-for-workload-management
You are monitoring an Azure Stream Analytics job.
You discover that the Backlogged input Events metric is increasing slowly and is consistently non-zero.
You need to ensure that the job can handle all the events.
What should you do?
Answer:
D
Backlogged Input Events: Number of input events that are backlogged. A non-zero value for this metric implies that your job isn't able to keep up with the number of incoming events. If this value is slowly increasing or consistently non-zero, you should scale out your job, by increasing the SUs.
Reference:
https://docs.microsoft.com/en-us/azure/stream-analytics/stream-analytics-monitoring
You have an Azure Stream Analytics job.
You need to ensure that the job has enough streaming units provisioned.
You configure monitoring of the SU % Utilization metric.
Which two additional metrics should you monitor? Each correct answer presents part of the solution.
NOTE: Each correct selection is worth one point.
Answer:
CD
To react to increased workloads and increase streaming units, consider setting an alert of 80% on the SU Utilization metric. Also, you can use watermark delay and backlogged events metrics to see if there is an impact.
Note: Backlogged Input Events: Number of input events that are backlogged. A non-zero value for this metric implies that your job isn't able to keep up with the number of incoming events. If this value is slowly increasing or consistently non-zero, you should scale out your job, by increasing the SUs.
Reference:
https://docs.microsoft.com/en-us/azure/stream-analytics/stream-analytics-monitoring
You have an Azure Databricks resource.
You need to log actions that relate to changes in compute for the Databricks resource.
Which Databricks services should you log?
Answer:
A
Clusters logs include information regarding changes in compute.
Incorrect:
Not E: Workspace logs do not include information related to changes in compute.
Reference:
https://docs.microsoft.com/en-us/azure/databricks/administration-guide/account-settings/azure-diagnostic-logs#configure-diagnostic-log-delivery
Your company uses Azure Stream Analytics to monitor devices.
The company plans to double the number of devices that are monitored.
You need to monitor a Stream Analytics job to ensure that there are enough processing resources to handle the additional load.
Which metric should you monitor?
Answer:
D
The Watermark delay metric is computed as the wall clock time of the processing node minus the largest watermark it has seen so far.
The watermark delay metric can rise due to:
1. Not enough processing resources in Stream Analytics to handle the volume of input events.
2. Not enough throughput within the input event brokers, so they are throttled.
3. Output sinks are not provisioned with enough capacity, so they are throttled.
Reference:
https://docs.microsoft.com/en-us/azure/stream-analytics/stream-analytics-time-handling
You manage an enterprise data warehouse in Azure Synapse Analytics.
Users report slow performance when they run commonly used queries. Users do not report performance changes for infrequently used queries.
You need to monitor resource utilization to determine the source of the performance issues.
Which metric should you monitor?
Answer:
D
You can use Azure Monitor to view cache metrics to troubleshoot query performance.
The key metrics for troubleshooting the cache are Cache hit percentage and Cache used percentage.
Possible scenario: Your current working data set cannot fit into the cache which causes a low cache hit percentage due to physical reads. Consider scaling up your performance level and rerun your workload to populate the cache.
Reference:
https://docs.microsoft.com/da-dk/azure/synapse-analytics/sql-data-warehouse/sql-data-warehouse-how-to-monitor-cache
You have an Azure Synapse Analytics dedicated SQL pool named Pool1 and a database named DB1. DB1 contains a fact table named Table.
You need to identify the extent of the data skew in Table1.
What should you do in Synapse Studio?
Answer:
A
First connect to Pool1, not the built-in serverless pool, then use sys.dm_pdw_nodes_db_partition_stats to analyze any skewness in the data.
Reference:
https://docs.microsoft.com/en-us/azure/synapse-analytics/sql-data-warehouse/cheat-sheet
You have an Azure Synapse Analytics dedicated SQL pool.
You run PDW_SHOWSPACEUSED('dbo.FactInternetSales'); and get the results shown in the following table.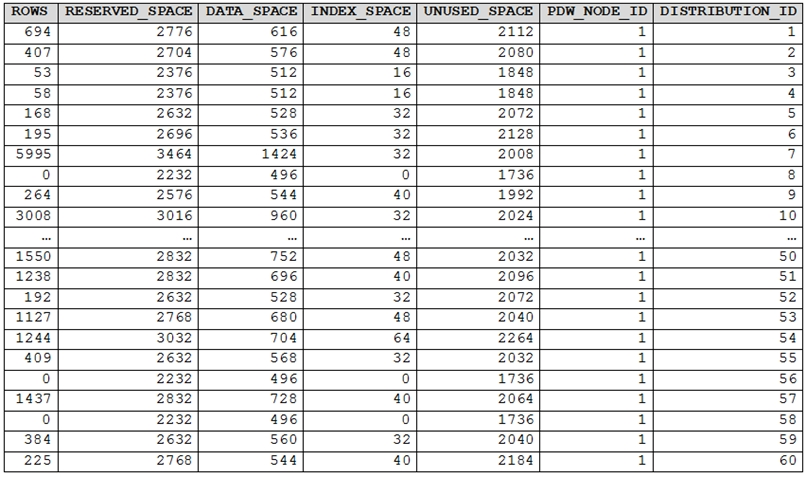
Which statement accurately describes the dbo.FactInternetSales table?
Answer:
D
The rows per distribution can vary up to 10% without a noticeable impact on performance. Here the distribution varies more than 10%. It is skewed.
Note: SHOWSPACEUSED displays the number of rows, disk space reserved, and disk space used for a specific table, or for all tables in a Azure Synapse
Analytics or Parallel Data Warehouse database.
This is a very quick and simple way to see the number of table rows that are stored in each of the 60 distributions of your database. Remember that for the most balanced performance, the rows in your distributed table should be spread evenly across all the distributions.
ROUND_ROBIN distributed tables should not be skewed. Data is distributed evenly across the nodes by design.
Reference:
https://docs.microsoft.com/en-us/azure/synapse-analytics/sql-data-warehouse/sql-data-warehouse-tables-distribute https://github.com/rgl/azure-content/blob/master/articles/sql-data-warehouse/sql-data-warehouse-manage-distributed-data-skew.md
DRAG DROP -
You have an Azure SQL managed instance named SQLMI1 that has Resource Governor enabled and is used by two apps named App1 and App2.
You need to configure SQLMI1 to limit the CPU and memory resources that can be allocated to App1.
Which four actions should you perform in sequence? To answer, move the appropriate actions from the list of actions to the answer area and arrange them in the correct order.
Select and Place: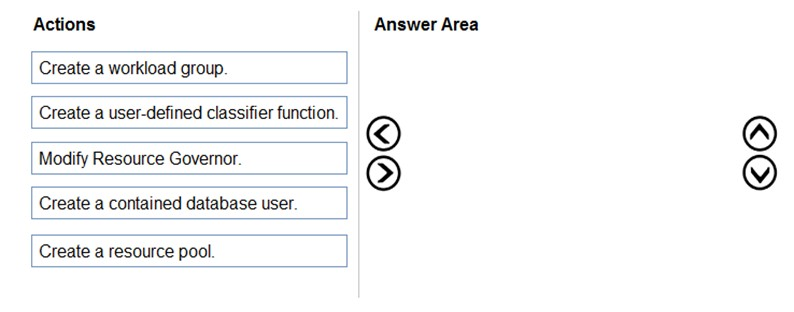
Answer:
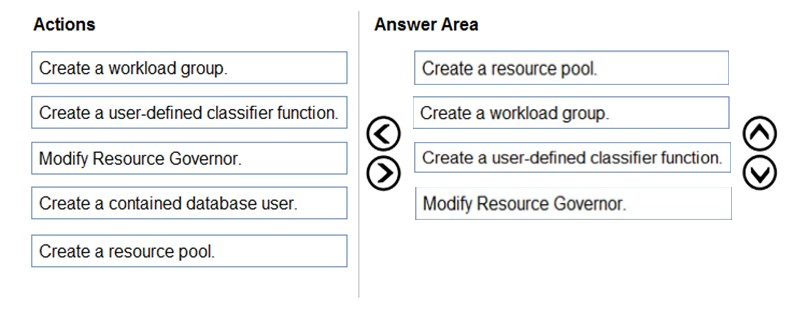
Reference:
https://docs.microsoft.com/en-us/sql/relational-databases/resource-governor/resource-governor?view=sql-server-ver15 https://docs.microsoft.com/en-us/sql/relational-databases/resource-governor/create-and-test-a-classifier-user-defined-function?view=sql-server-ver15
Note: This question is part of a series of questions that present the same scenario. Each question in the series contains a unique solution that might meet the stated goals. Some question sets might have more than one correct solution, while others might not have a correct solution.
After you answer a question in this section, you will NOT be able to return to it. As a result, these questions will not appear in the review screen.
You have SQL Server 2019 on an Azure virtual machine.
You are troubleshooting performance issues for a query in a SQL Server instance.
To gather more information, you query sys.dm_exec_requests and discover that the wait type is PAGELATCH_UP and the wait_resource is 2:3:905856.
You need to improve system performance.
Solution: You shrink the transaction log file.
Does this meet the goal?
Answer:
B
You should instead reduce the use of table variables and temporary tables.
Or you could create additional tempdb files.
Note: The following operations use tempdb extensively:
* Repetitive create-and-drop operation of temporary tables (local or global).
* Table variables that use tempdb for storage.
* Etc.
Reference:
https://docs.microsoft.com/en-US/troubleshoot/sql/performance/recommendations-reduce-allocation-contention