You are evaluating a completed binary classification machine learning model.
You need to use the precision as the evaluation metric.
Which visualization should you use?
Answer:
D
Receiver operating characteristic (or ROC) is a plot of the correctly classified labels vs. the incorrectly classified labels for a particular model.
Incorrect Answers:
A: A violin plot is a visual that traditionally combines a box plot and a kernel density plot.
B: Gradient descent is a first-order iterative optimization algorithm for finding the minimum of a function. To find a local minimum of a function using gradient descent, one takes steps proportional to the negative of the gradient (or approximate gradient) of the function at the current point.
C: A scatter plot graphs the actual values in your data against the values predicted by the model. The scatter plot displays the actual values along the X-axis, and displays the predicted values along the Y-axis. It also displays a line that illustrates the perfect prediction, where the predicted value exactly matches the actual value.
Reference:
https://docs.microsoft.com/en-us/azure/machine-learning/how-to-understand-automated-ml#confusion-matrix
You are solving a classification task.
You must evaluate your model on a limited data sample by using k-fold cross-validation. You start by configuring a k parameter as the number of splits.
You need to configure the k parameter for the cross-validation.
Which value should you use?
Answer:
B
Leave One Out (LOO) cross-validation
Setting K = n (the number of observations) yields n-fold and is called leave-one out cross-validation (LOO), a special case of the K-fold approach.
LOO CV is sometimes useful but typically doesn't shake up the data enough. The estimates from each fold are highly correlated and hence their average can have high variance.
This is why the usual choice is K=5 or 10. It provides a good compromise for the bias-variance tradeoff.
HOTSPOT -
You have a dataset created for multiclass classification tasks that contains a normalized numerical feature set with 10,000 data points and 150 features.
You use 75 percent of the data points for training and 25 percent for testing. You are using the scikit-learn machine learning library in Python. You use X to denote the feature set and Y to denote class labels.
You create the following Python data frames: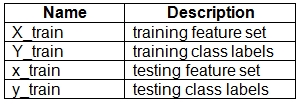
You need to apply the Principal Component Analysis (PCA) method to reduce the dimensionality of the feature set to 10 features in both training and testing sets.
How should you complete the code segment? To answer, select the appropriate options in the answer area.
NOTE: Each correct selection is worth one point.
Hot Area: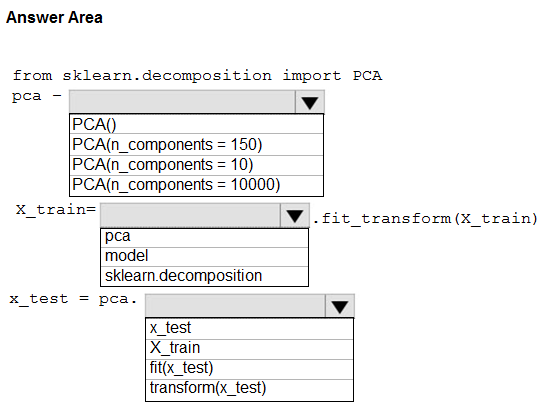
Answer:
Box 1: PCA(n_components = 10)
Need to reduce the dimensionality of the feature set to 10 features in both training and testing sets.
Example:
from sklearn.decomposition import PCA
pca = PCA(n_components=2) ;2 dimensions
principalComponents = pca.fit_transform(x)
Box 2: pca -
fit_transform(X[, y]) fits the model with X and apply the dimensionality reduction on X.
Box 3: transform(x_test)
transform(X) applies dimensionality reduction to X.
Reference:
https://scikit-learn.org/stable/modules/generated/sklearn.decomposition.PCA.html
HOTSPOT -
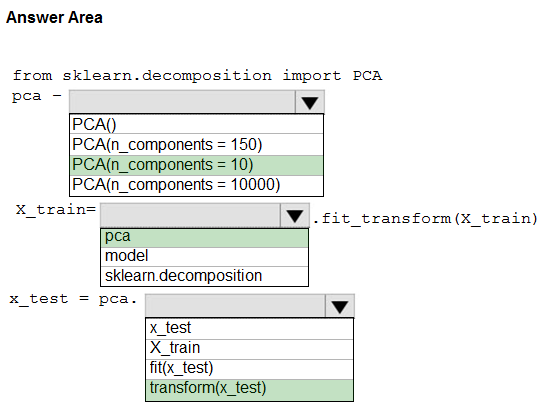
You have a feature set containing the following numerical features: X, Y, and Z.
The Poisson correlation coefficient (r-value) of X, Y, and Z features is shown in the following image: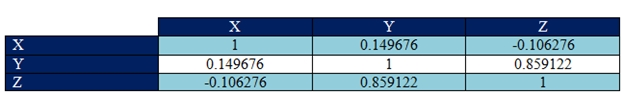
Use the drop-down menus to select the answer choice that answers each question based on the information presented in the graphic.
NOTE: Each correct selection is worth one point.
Hot Area: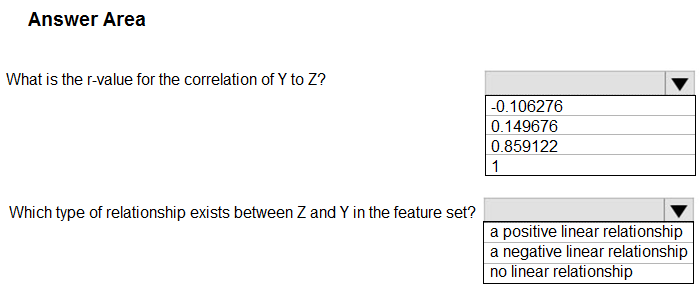
Answer:
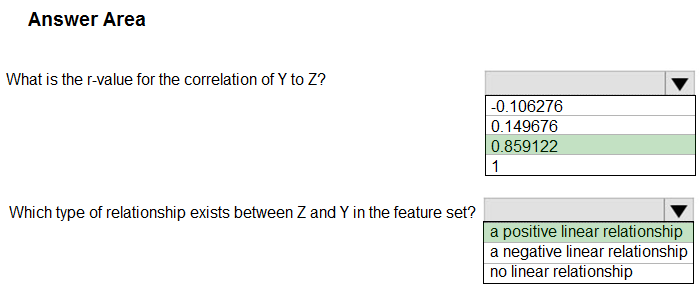
Box 1: 0.859122 -
Box 2: a positively linear relationship
+1 indicates a strong positive linear relationship
-1 indicates a strong negative linear correlation
0 denotes no linear relationship between the two variables.
Reference:
https://docs.microsoft.com/en-us/azure/machine-learning/studio-module-reference/compute-linear-correlation
DRAG DROP -
You plan to explore demographic data for home ownership in various cities. The data is in a CSV file with the following format: age,city,income,home_owner
21,Chicago,50000,0
35,Seattle,120000,1
23,Seattle,65000,0
45,Seattle,130000,1
18,Chicago,48000,0
You need to run an experiment in your Azure Machine Learning workspace to explore the data and log the results. The experiment must log the following information:
✑ the number of observations in the dataset
✑ a box plot of income by home_owner
✑ a dictionary containing the city names and the average income for each city
You need to use the appropriate logging methods of the experiment's run object to log the required information.
How should you complete the code? To answer, drag the appropriate code segments to the correct locations. Each code segment may be used once, more than once, or not at all. You may need to drag the split bar between panes or scroll to view content.
NOTE: Each correct selection is worth one point.
Select and Place: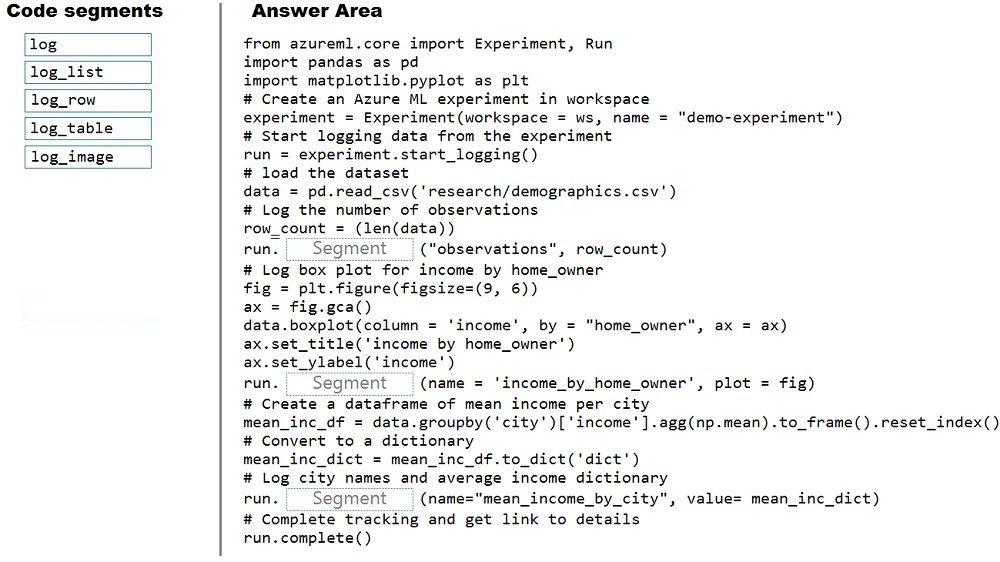
Answer:
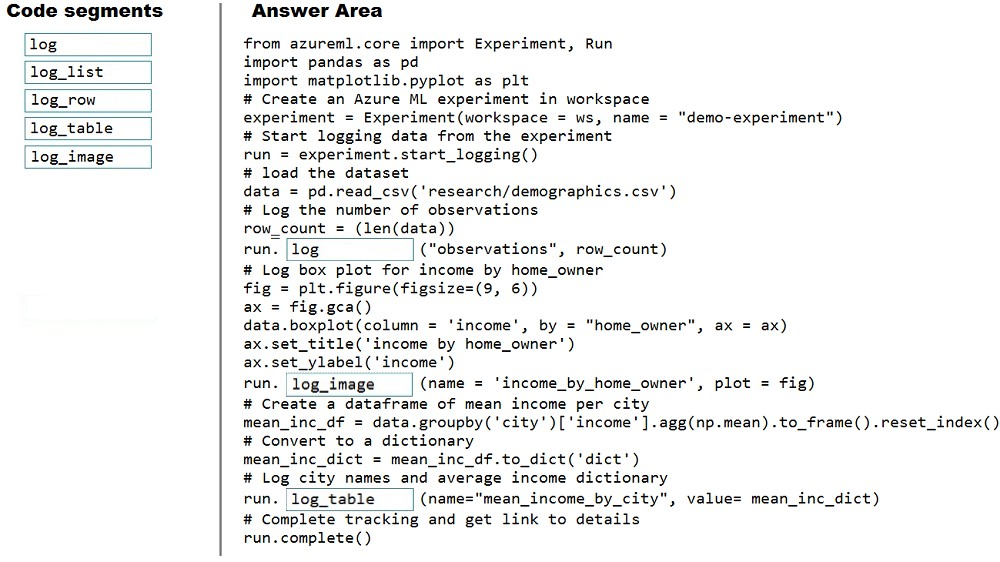
Box 1: log -
The number of observations in the dataset.
run.log(name, value, description='')
Scalar values: Log a numerical or string value to the run with the given name. Logging a metric to a run causes that metric to be stored in the run record in the experiment. You can log the same metric multiple times within a run, the result being considered a vector of that metric.
Example: run.log("accuracy", 0.95)
Box 2: log_image -
A box plot of income by home_owner.
log_image Log an image to the run record. Use log_image to log a .PNG image file or a matplotlib plot to the run. These images will be visible and comparable in the run record.
Example: run.log_image("ROC", plot=plt)
Box 3: log_table -
A dictionary containing the city names and the average income for each city. log_table: Log a dictionary object to the run with the given name.
You use the Azure Machine Learning service to create a tabular dataset named training_data. You plan to use this dataset in a training script.
You create a variable that references the dataset using the following code: training_ds = workspace.datasets.get("training_data")
You define an estimator to run the script.
You need to set the correct property of the estimator to ensure that your script can access the training_data dataset.
Which property should you set?
Answer:
B
Example:
# Get the training dataset
diabetes_ds = ws.datasets.get("Diabetes Dataset")
# Create an estimator that uses the remote compute
hyper_estimator = SKLearn(source_directory=experiment_folder, inputs=[diabetes_ds.as_named_input('diabetes')], # Pass the dataset as an input compute_target = cpu_cluster, conda_packages=['pandas','ipykernel','matplotlib'], pip_packages=['azureml-sdk','argparse','pyarrow'], entry_script='diabetes_training.py')
Reference:
https://notebooks.azure.com/GraemeMalcolm/projects/azureml-primers/html/04%20-%20Optimizing%20Model%20Training.ipynb
You register a file dataset named csv_folder that references a folder. The folder includes multiple comma-separated values (CSV) files in an Azure storage blob container.
You plan to use the following code to run a script that loads data from the file dataset. You create and instantiate the following variables: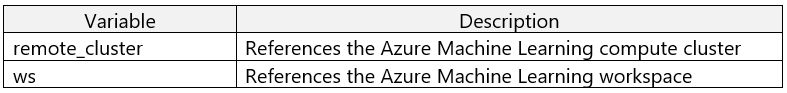
You have the following code: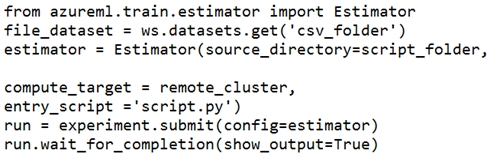
You need to pass the dataset to ensure that the script can read the files it references.
Which code segment should you insert to replace the code comment?
Answer:
B
Example:
from azureml.train.estimator import Estimator
script_params = {
# to mount files referenced by mnist dataset
'--data-folder': mnist_file_dataset.as_named_input('mnist_opendataset').as_mount(),
'--regularization': 0.5
}
est = Estimator(source_directory=script_folder,
script_params=script_params,
compute_target=compute_target,
environment_definition=env,
entry_script='train.py')
Reference:
https://docs.microsoft.com/en-us/azure/machine-learning/tutorial-train-models-with-aml
You are creating a new Azure Machine Learning pipeline using the designer.
The pipeline must train a model using data in a comma-separated values (CSV) file that is published on a website. You have not created a dataset for this file.
You need to ingest the data from the CSV file into the designer pipeline using the minimal administrative effort.
Which module should you add to the pipeline in Designer?
Answer:
D
The preferred way to provide data to a pipeline is a Dataset object. The Dataset object points to data that lives in or is accessible from a datastore or at a Web
URL. The Dataset class is abstract, so you will create an instance of either a FileDataset (referring to one or more files) or a TabularDataset that's created by from one or more files with delimited columns of data.
Example:
from azureml.core import Dataset
iris_tabular_dataset = Dataset.Tabular.from_delimited_files([(def_blob_store, 'train-dataset/iris.csv')])
Reference:
https://docs.microsoft.com/en-us/azure/machine-learning/how-to-create-your-first-pipeline
You define a datastore named ml-data for an Azure Storage blob container. In the container, you have a folder named train that contains a file named data.csv.
You plan to use the file to train a model by using the Azure Machine Learning SDK.
You plan to train the model by using the Azure Machine Learning SDK to run an experiment on local compute.
You define a DataReference object by running the following code: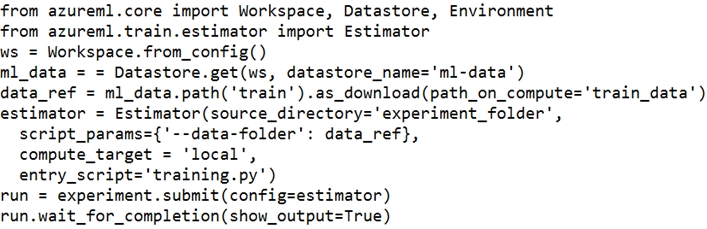
You need to load the training data.
Which code segment should you use?
A.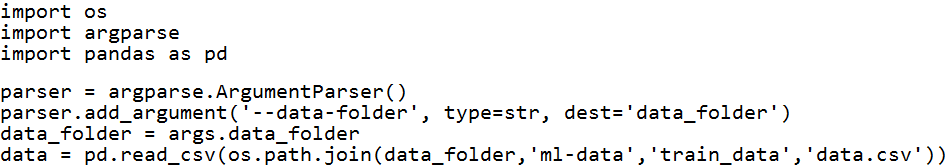
B.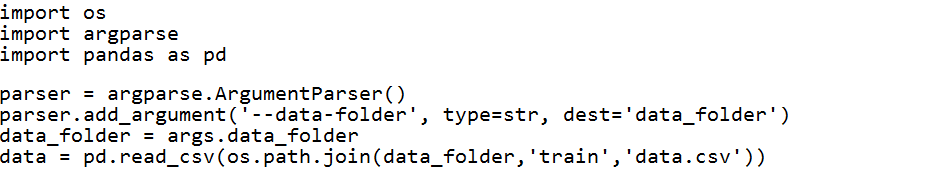
C.
D.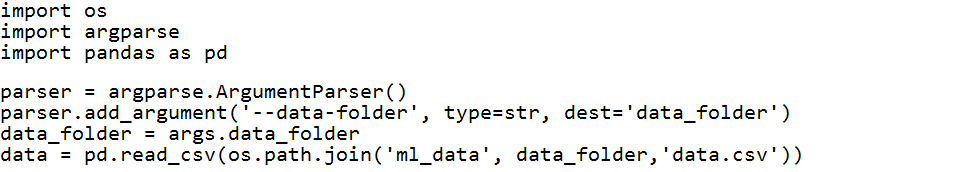
E.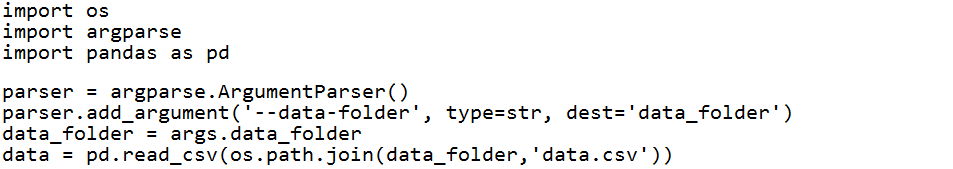
Answer:
E
Example:
data_folder = args.data_folder
# Load Train and Test data
train_data = pd.read_csv(os.path.join(data_folder, 'data.csv'))
Reference:
https://www.element61.be/en/resource/azure-machine-learning-services-complete-toolbox-ai
Note: This question is part of a series of questions that present the same scenario. Each question in the series contains a unique solution that might meet the stated goals. Some question sets might have more than one correct solution, while others might not have a correct solution.
After you answer a question in this section, you will NOT be able to return to it. As a result, these questions will not appear in the review screen.
You create an Azure Machine Learning service datastore in a workspace. The datastore contains the following files:
✑ /data/2018/Q1.csv
✑ /data/2018/Q2.csv
✑ /data/2018/Q3.csv
✑ /data/2018/Q4.csv
✑ /data/2019/Q1.csv
All files store data in the following format:
id,f1,f2,I
1,1,2,0
2,1,1,1
3,2,1,0
4,2,2,1
You run the following code: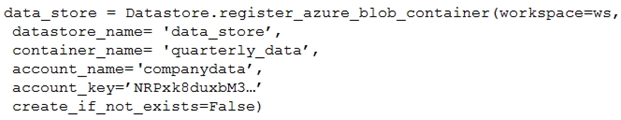
You need to create a dataset named training_data and load the data from all files into a single data frame by using the following code:
Solution: Run the following code: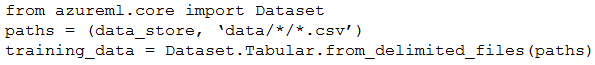
Does the solution meet the goal?
Answer:
B
Define paths with two file paths instead.
Use Dataset.Tabular_from_delimeted as the data isn't cleansed.
Reference:
https://docs.microsoft.com/en-us/azure/machine-learning/how-to-create-register-datasets