HOTSPOT -
You have a Python data frame named salesData in the following format: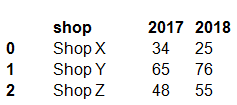
The data frame must be unpivoted to a long data format as follows: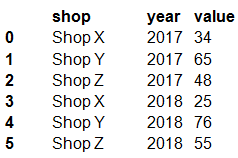
You need to use the pandas.melt() function in Python to perform the transformation.
How should you complete the code segment? To answer, select the appropriate options in the answer area.
NOTE: Each correct selection is worth one point.
Hot Area:
Answer:

Box 1: dataFrame -
Syntax: pandas.melt(frame, id_vars=None, value_vars=None, var_name=None, value_name='value', col_level=None)[source]
Where frame is a DataFrame -
Box 2: shop -
Paramter id_vars id_vars : tuple, list, or ndarray, optional
Column(s) to use as identifier variables.
Box 3: ['2017','2018']
value_vars : tuple, list, or ndarray, optional
Column(s) to unpivot. If not specified, uses all columns that are not set as id_vars.
Example:
df = pd.DataFrame({'A': {0: 'a', 1: 'b', 2: 'c'},
... 'B': {0: 1, 1: 3, 2: 5},
... 'C': {0: 2, 1: 4, 2: 6}})
pd.melt(df, id_vars=['A'], value_vars=['B', 'C'])
A variable value -
0 a B 1
1 b B 3
2 c B 5
3 a C 2
4 b C 4
5 c C 6
Reference:
https://pandas.pydata.org/pandas-docs/stable/reference/api/pandas.melt.html
HOTSPOT -
You are working on a classification task. You have a dataset indicating whether a student would like to play soccer and associated attributes. The dataset includes the following columns:
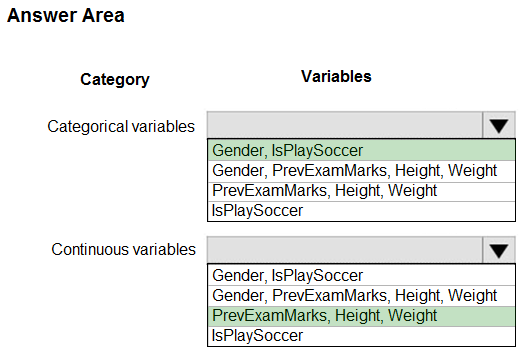
You need to classify variables by type.
Which variable should you add to each category? To answer, select the appropriate options in the answer area.
NOTE: Each correct selection is worth one point.
Hot Area: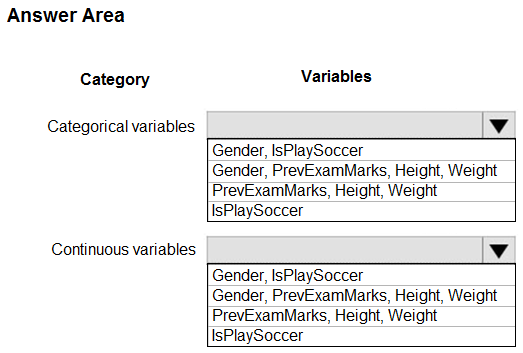
Answer:
Reference:
https://www.edureka.co/blog/classification-algorithms/
HOTSPOT -
You plan to preprocess text from CSV files. You load the Azure Machine Learning Studio default stop words list.
You need to configure the Preprocess Text module to meet the following requirements:
✑ Ensure that multiple related words from a single canonical form.
✑ Remove pipe characters from text.
Remove words to optimize information retrieval.
Which three options should you select? To answer, select the appropriate options in the answer area.
NOTE: Each correct selection is worth one point.
Hot Area: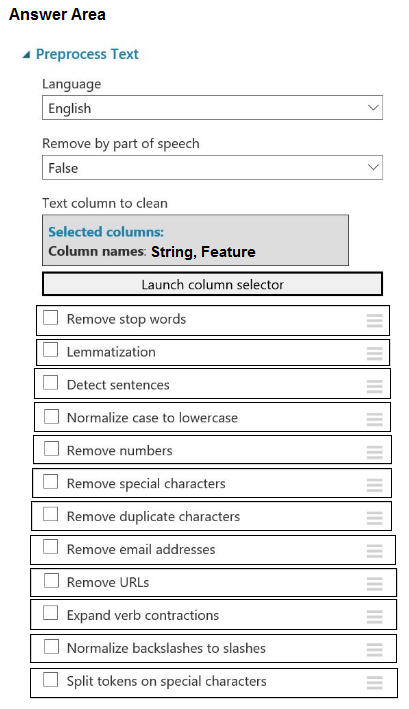
Answer:
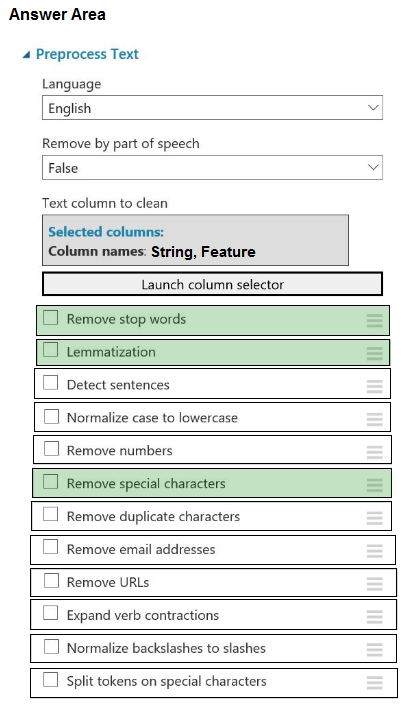
Box 1: Remove stop words -
Remove words to optimize information retrieval.
Remove stop words: Select this option if you want to apply a predefined stopword list to the text column. Stop word removal is performed before any other processes.
Box 2: Lemmatization -
Ensure that multiple related words from a single canonical form.
Lemmatization converts multiple related words to a single canonical form
Box 3: Remove special characters
Remove special characters: Use this option to replace any non-alphanumeric special characters with the pipe | character.
Reference:
https://docs.microsoft.com/en-us/azure/machine-learning/studio-module-reference/preprocess-text
You plan to run a script as an experiment using a Script Run Configuration. The script uses modules from the scipy library as well as several Python packages that are not typically installed in a default conda environment.
You plan to run the experiment on your local workstation for small datasets and scale out the experiment by running it on more powerful remote compute clusters for larger datasets.
You need to ensure that the experiment runs successfully on local and remote compute with the least administrative effort.
What should you do?
Answer:
C
If you have an existing Conda environment on your local computer, then you can use the service to create an environment object. By using this strategy, you can reuse your local interactive environment on remote runs.
Reference:
https://docs.microsoft.com/en-us/azure/machine-learning/how-to-use-environments
You write a Python script that processes data in a comma-separated values (CSV) file.
You plan to run this script as an Azure Machine Learning experiment.
The script loads the data and determines the number of rows it contains using the following code: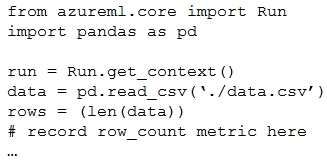
You need to record the row count as a metric named row_count that can be returned using the get_metrics method of the Run object after the experiment run completes.
Which code should you use?
Answer:
B
Log a numerical or string value to the run with the given name using log(name, value, description=''). Logging a metric to a run causes that metric to be stored in the run record in the experiment. You can log the same metric multiple times within a run, the result being considered a vector of that metric.
Example: run.log("accuracy", 0.95)
Incorrect Answers:
E: Using log_row(name, description=None, **kwargs) creates a metric with multiple columns as described in kwargs. Each named parameter generates a column with the value specified. log_row can be called once to log an arbitrary tuple, or multiple times in a loop to generate a complete table.
Example: run.log_row("Y over X", x=1, y=0.4)
Reference:
https://docs.microsoft.com/en-us/python/api/azureml-core/azureml.core.run
Note: This question is part of a series of questions that present the same scenario. Each question in the series contains a unique solution that might meet the stated goals. Some question sets might have more than one correct solution, while others might not have a correct solution.
After you answer a question in this section, you will NOT be able to return to it. As a result, these questions will not appear in the review screen.
You are creating a new experiment in Azure Machine Learning Studio.
One class has a much smaller number of observations than the other classes in the training set.
You need to select an appropriate data sampling strategy to compensate for the class imbalance.
Solution: You use the Synthetic Minority Oversampling Technique (SMOTE) sampling mode.
Does the solution meet the goal?
Answer:
A
SMOTE is used to increase the number of underepresented cases in a dataset used for machine learning. SMOTE is a better way of increasing the number of rare cases than simply duplicating existing cases.
Reference:
https://docs.microsoft.com/en-us/azure/machine-learning/studio-module-reference/smote
Note: This question is part of a series of questions that present the same scenario. Each question in the series contains a unique solution that might meet the stated goals. Some question sets might have more than one correct solution, while others might not have a correct solution.
After you answer a question in this section, you will NOT be able to return to it. As a result, these questions will not appear in the review screen.
You are creating a new experiment in Azure Machine Learning Studio.
One class has a much smaller number of observations than the other classes in the training set.
You need to select an appropriate data sampling strategy to compensate for the class imbalance.
Solution: You use the Stratified split for the sampling mode.
Does the solution meet the goal?
Answer:
B
Instead use the Synthetic Minority Oversampling Technique (SMOTE) sampling mode.
Note: SMOTE is used to increase the number of underepresented cases in a dataset used for machine learning. SMOTE is a better way of increasing the number of rare cases than simply duplicating existing cases.
Reference:
https://docs.microsoft.com/en-us/azure/machine-learning/studio-module-reference/smote
You are creating a machine learning model.
You need to identify outliers in the data.
Which two visualizations can you use? Each correct answer presents a complete solution.
NOTE: Each correct selection is worth one point.
Answer:
BE
The box-plot algorithm can be used to display outliers.
One other way to quickly identify Outliers visually is to create scatter plots.
Reference:
https://blogs.msdn.microsoft.com/azuredev/2017/05/27/data-cleansing-tools-in-azure-machine-learning/
You are evaluating a completed binary classification machine learning model.
You need to use the precision as the evaluation metric.
Which visualization should you use?
Answer:
D
Incorrect Answers:
A: A violin plot is a visual that traditionally combines a box plot and a kernel density plot.
B: Gradient descent is a first-order iterative optimization algorithm for finding the minimum of a function. To find a local minimum of a function using gradient descent, one takes steps proportional to the negative of the gradient (or approximate gradient) of the function at the current point.
C: A box plot lets you see basic distribution information about your data, such as median, mean, range and quartiles but doesn't show you how your data looks throughout its range.
Reference:
https://machinelearningknowledge.ai/confusion-matrix-and-performance-metrics-machine-learning/
You create a multi-class image classification deep learning model that uses the PyTorch deep learning framework.
You must configure Azure Machine Learning Hyperdrive to optimize the hyperparameters for the classification model.
You need to define a primary metric to determine the hyperparameter values that result in the model with the best accuracy score.
Which three actions must you perform? Each correct answer presents part of the solution.
NOTE: Each correct selection is worth one point.
Answer:
ADF
AD:
primary_metric_name="accuracy",
primary_metric_goal=PrimaryMetricGoal.MAXIMIZE
Optimize the runs to maximize "accuracy". Make sure to log this value in your training script.
Note:
primary_metric_name: The name of the primary metric to optimize. The name of the primary metric needs to exactly match the name of the metric logged by the training script. primary_metric_goal: It can be either PrimaryMetricGoal.MAXIMIZE or PrimaryMetricGoal.MINIMIZE and determines whether the primary metric will be maximized or minimized when evaluating the runs.
F: The training script calculates the val_accuracy and logs it as "accuracy", which is used as the primary metric.